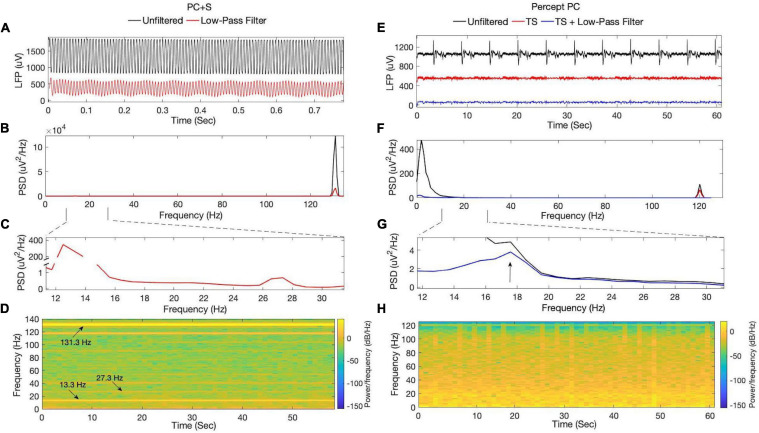
FIGURE 3.
ON-stimulation, OFF-medication LFPs recorded by the (A–D) PC + S and (E–H) Percept PC from the left STN. Signals from PC + S were collected 11 months after lead implantation. (A) Time-series data and their (B,C) corresponding power spectra demonstrate substantial stimulation artifact at 131.3 Hz and its subharmonics, including within the beta-band at 13.3 and 27.3 Hz. (D) Spectrogram analysis of filtered data reveals high spectral power at the stimulation rate and subharmonics, which remained constant during the duration of the recording. From Percept PC, (E) time-series data and their (F,G) corresponding power spectra demonstrate an aliased stimulation artifact at 120 Hz, which is less prominent in amplitude than that seen with the PC + S. A recurrent non-physiologic artifact occurring approximately every 5.8 s was also seen. Low-pass filtering and removal of the artifact by template subtraction revealed an underlying peak in the beta-band around 17.5 Hz. (H) Spectrogram analysis of filtered data from the Percept (after template subtraction and low-pass filtering) revealed variability in beta-band power over the duration of the recording. TS, Template subtraction; PSD, Power spectral density.

