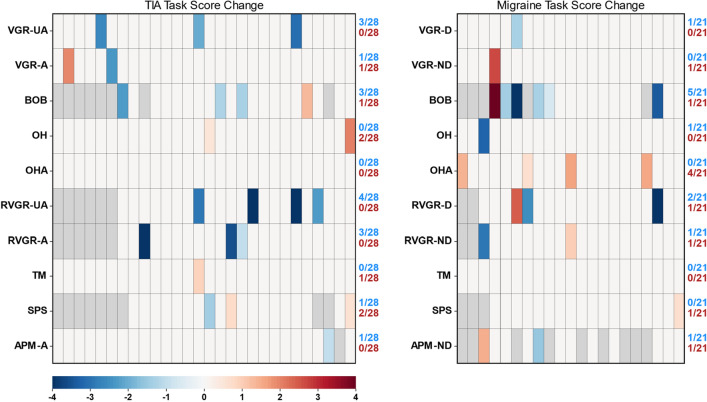
Figure 3.
Heatmaps of significant changes in TIA and migraine groups between 2-weeks and 1-year. Participants are arrayed along the x-axes in no particular order. -A affected arm, -UA unaffected arm, -D dominant arm, -ND non-dominant arm. Blue cells represent significant lowering (improvement) in Task Score between 2 weeks and 1 year. Red cells represent significant increase (deterioration) in Task Score between 2 weeks and 1 year. Gray cells indicate missing values for those participants. Fractions improved and deteriorated are represented on the right-hand side of each axis for each task.

