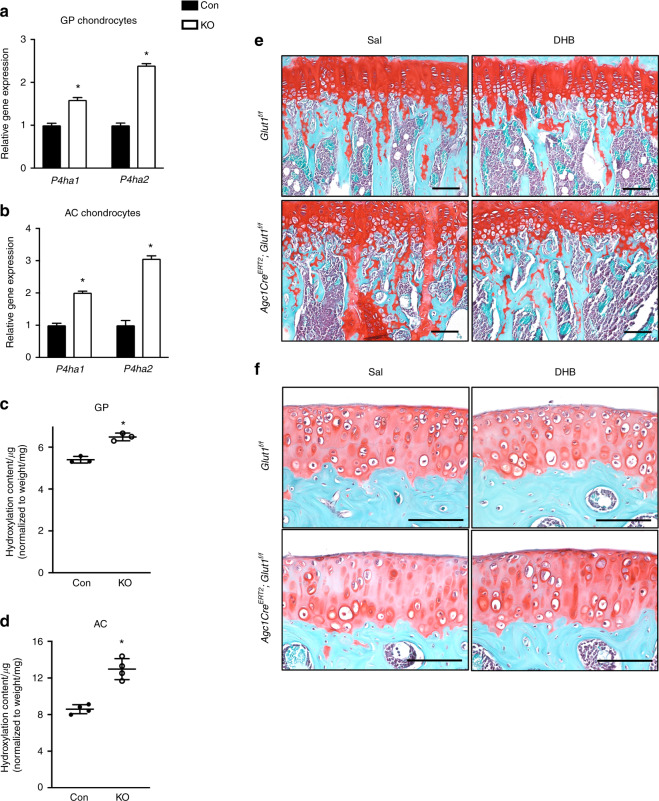
Fig. 7.
Inhibition of P4h in vivo normalizes increased the amount of cartilage remnants in the metaphyseal region in Glut1 LOF mice. a–b RT-qPCR analyses for P4ha1 and P4ha2 in control and Glut1 KO primary GP chondrocytes. The data are the mean ± SD. N = 3. *P < 0.05 relative to the controls. c–d Hydroxyproline levels in control and Glut1 LOF neonatal growth plates and 3-week-old articular cartilage from femoral heads. All data are normalized to the tissue weight. The data are the mean ± SD. N = 3 or 4 biologically independent samples. *P < 0.05 compared to the controls. e–f Safranin O/Fast Green staining of tibia and knee sections of 3-month-old control and Glut1 LOF mice following DHB or saline treatment for 2 months. N = 5. Scale bar, 100 μm

