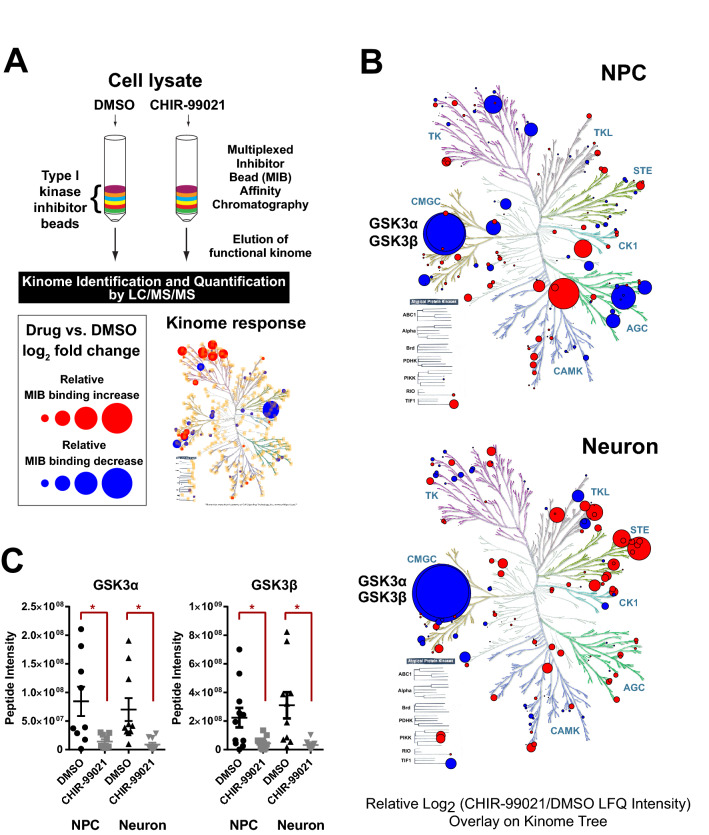
Figure 5.
Effect of CHIR-99021 on the kinome in human NPC and neurons. (A) Schematic of the MIB-MS (Multiplexed Inhibitor Bead matrix followed by Mass Spectrometry) methodology. (B) Response of kinases in NPC and iNgn2 neurons to 24 h treatment with CHIR-99021 (1 μM) represented in a kinome tree. Magnitude of the LFQ intensity is represented by the sizes of the dots in the kinome tree; blue dots represent negative values and red dots represent positive values. (C) Scatter dot plot of GSK3α and GSK3β peptide intensity from mass spectrometry in NPC or neurons with CHIR-99021 (1 μM) or DMSO treatment. For each condition, the horizontal line represents the mean and the error bar represents SEM. Unpaired t-test with Welch’s correction was performed, *p < 0.05. Kinome trees produced using Kinome Render and illustration reproduced courtesy of Cell Signaling Technology, Inc. (www.cellsignal.com)80.

