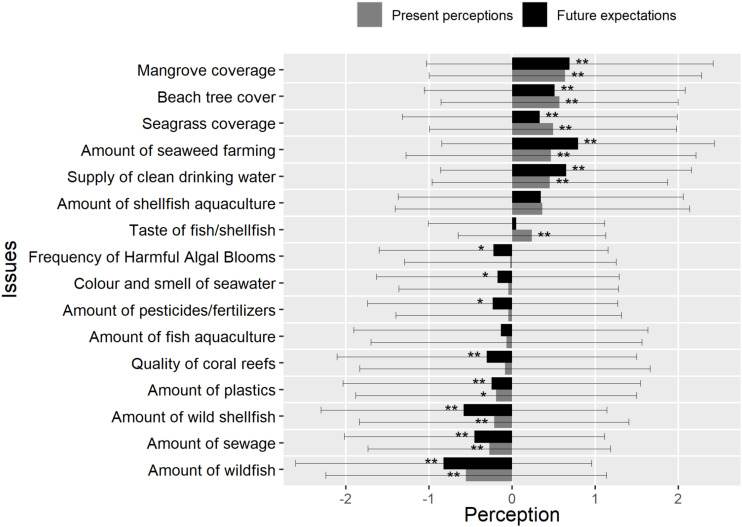
FIGURE 2.
Response of respondents to questions, “What do you think of the following compared to 10 years ago?” (Present perception) and “What do you think of the following in the next 10 years compared to now?” (Future expectation) with the following options (the x axis): –3 is much worse, –2 is worse, –1 is slightly worse, 0 is the same, 1 is slightly better, 2 is better, and 3 is much better. Issues with ** are areas where high significant differences were observed (p < 0.01). Issues with * are areas where significant differences were observed (p < 0.05).

