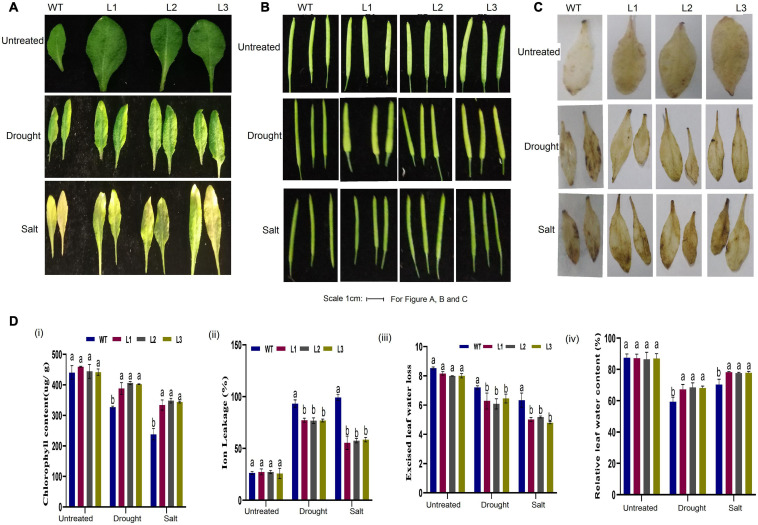
FIGURE 10.
Phenotypic observation of leaf and seed pods and physiological analysis. (A) Representative leaf image of WT and overexpressed lines before and after drought and salt treatment. (B) Representative image of the seed pod of WT and overexpressed lines before and after drought and salt treatment. (C) DAB staining assay of WT and GhACX3-overexpressed lines in untreated, drought, and salt stress plants. (D) Quantitative determination of (i) chlorophyll content, (ii) ion leakage, (iii) excised leaf water loss, and (iv) relative leaf water content. Different letters indicate significant differences between wild-type and VIGS plants (ANOVA; p < 0.05). Untreated indicates normal conditions.

