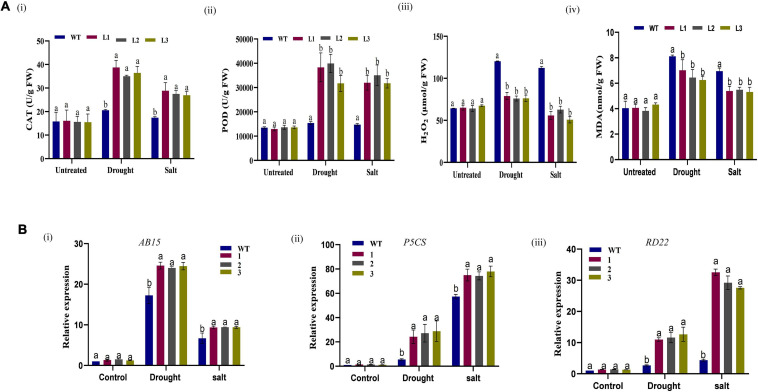
FIGURE 11.
Biochemical analysis and qRT-PCR analysis of abiotic stress responsive genes in Arabidopsis plants. (A) (i–iv) Quantitative determination of CAT, POD, H2O2, and MDA in WT and overexpressed lines before and after stress treatment. (B) Relative expression of stress-responsive genes in WT and overexpressed GhACX3 Arabidopsis plants. (i) Relative expression of AB15, (ii) relative expression of P5CS, and (iii) relative expression of RD22. Error bars represent SD for three biological replicates. Different letters above the columns indicate significant differences at P < 0.05. Untreated indicates normal conditions.

