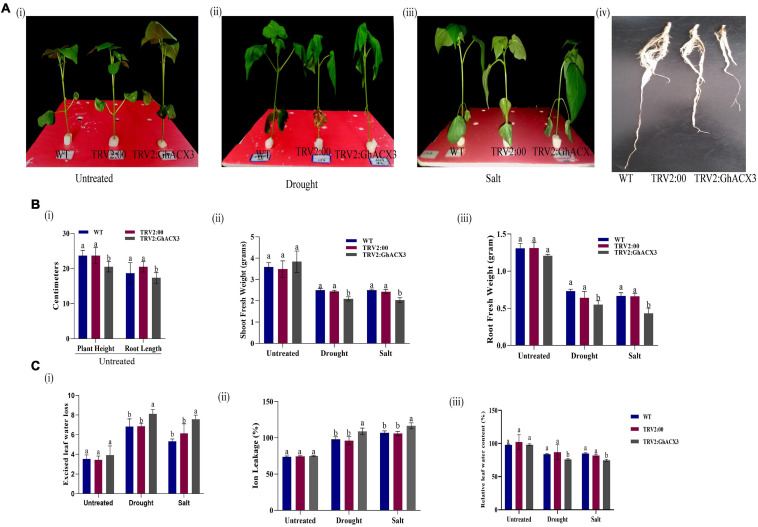
FIGURE 7.
Phenotypic observation of the plants’ morphological and physiological evaluation. (A) (i–iii) Representative images of the WT, TRV2: 00, (empty vector), TRV2: GhACX3 (silenced plants), and (iv) root morphological difference between WT, TRV2:00, and GhACX3 plants before drought and salt stress treatment. (B) Determination of (i–iii) plant height and root length, shoot fresh weight and root fresh weight of untreated, drought, and salt-treated plants. (C) Quantitative determination of (i–iii) excised leaf water loss, ion leakage, and relative leaf water content in untreated, drought, and salt-treated plants. Each experiment was repeated three times, bar indicates standard error (SE). Different letters indicate significant differences between wild-type and VIGS plants (ANOVA; p < 0.05). Untreated indicates normal conditions.

