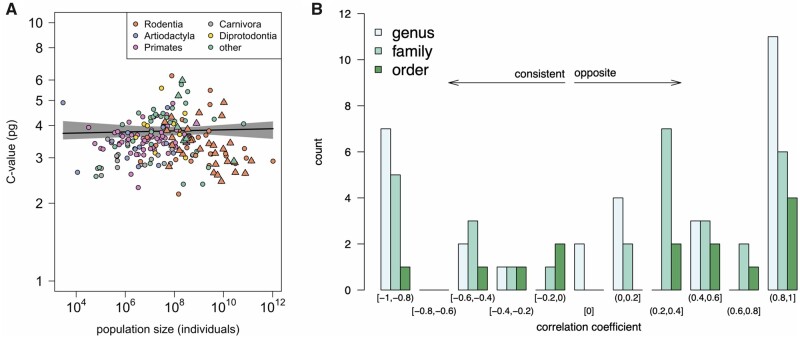
Fig. 1.
Relationship between genome size (C-value) and population size for mammals. (A) No correlation between genome size and population size. Points represent individual species, and points are colored according to their taxonomic order. Point symbols distinguish large- (circles) and small-bodied (triangles) mammals used in the regressions. The solid line and shading represent the mean and confidence intervals for the phylogenetic regression, which was not statistically significant. (B) Correlations within taxonomic ranks. For all three ranks, fewer taxonomic groups show a negative correlation (consistent with the prediction) than show a positive correlation (opposite to the prediction).

