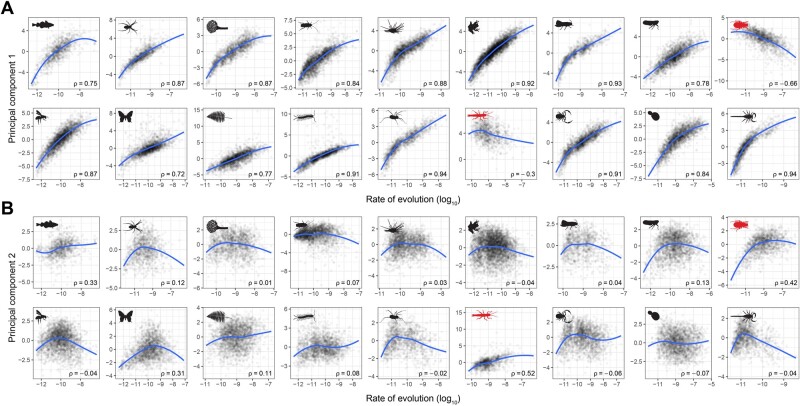
Fig. 2.
Rate of evolution is the primary factor driving differences in gene properties. Scores of loci along PCs 1 (A) and 2 (B) were correlated against the log-transformed harmonic means of site rates. Blue lines correspond to LOESS regressions, and Spearman’s rank correlation coefficients (ρ) are shown in each plot. Clade icons are as in figure 1; the deviating hexapod and phasmatodean data sets are highlighted in red. Results using a tree-based estimate of evolutionary rates are shown in supplementary figure S4, Supplementary Material online.

