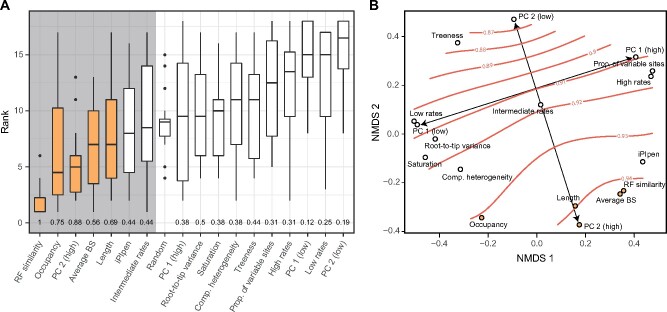
Fig. 3.
Comparison of the performance of alternative subsampling strategies. (A) Distribution of ranks attained by different strategies (lower ranks represent better results). Two criteria for selecting adequate strategies are highlighted: those whose median ranks are lower than randomly chosen loci (grey background), and those that outperform these in more than half of the data sets (yellow bars). The proportion of times a given strategy ranks better than random loci is shown at the bottom. Results correspond to matrices of 250 loci; those for 50 loci are shown in supplementary figure S7, Supplementary Material online. (B) NMDS of pair-wise distances between strategies, representing the average frequency with which they share loci (smaller distances represent higher probabilities of targeting the same loci). Average RF similarity (orange lines) is overlayed as a smooth surface. PC 2 defines an axis that traverses the RF similarity gradient, whereas PC 1 (and other rate proxies) sample genes along a perpendicular axis that follows an isocline.

