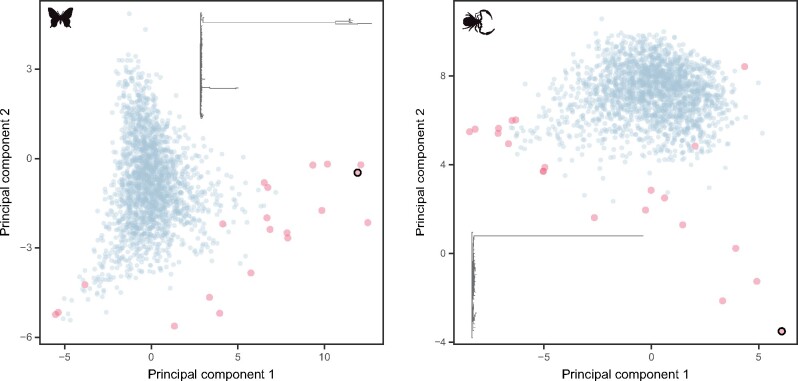
Fig. 4.
Detection of outlier genes using multiple gene properties in two exemplary data sets, Lepidoptera (left) and Pseudoscorpiones (right). Plots show the PC axes built from the entire data sets, with the genes considered outliers shown in red. The topology of the largest outlier (highlighted with a black border) is plotted.

