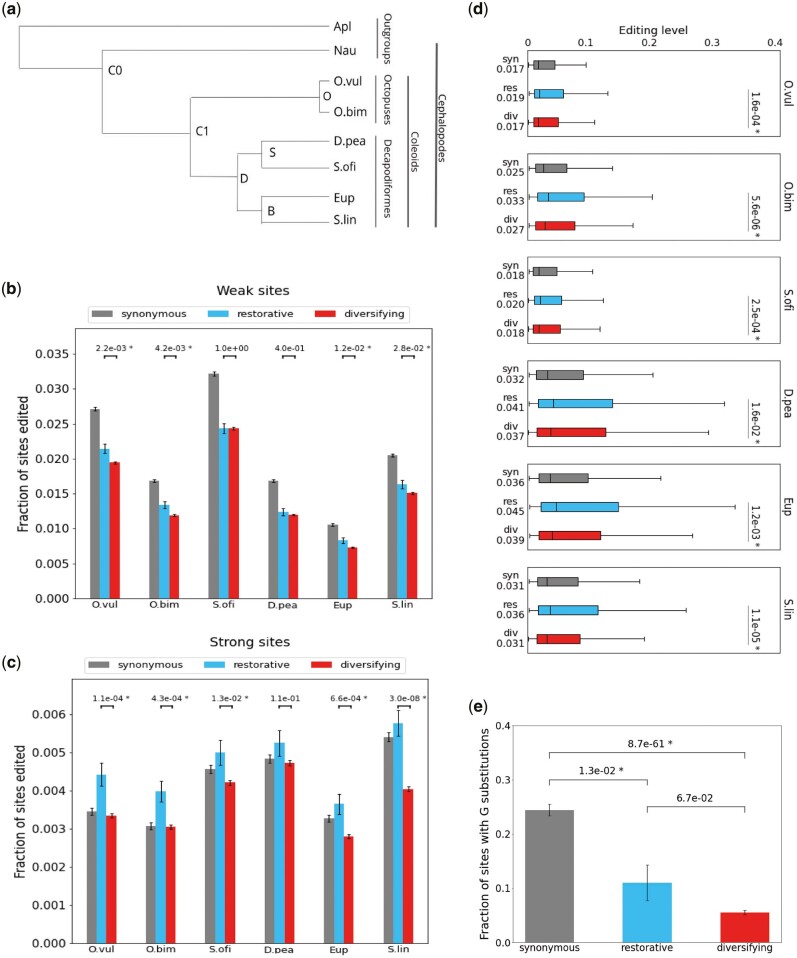
Fig. 2.
Restorative and diversifying editing. (a) Phylogeny of the eight species studied here: six coleoids and two outgroup mollusks (see Materials and Methods). (b) Incidence of weak editing (<10%) in synonymous, restorative, and diversifying sites, for each of the six coleoid species. P values for the difference between the incidence rate of restorative and diversifying sites are indicated (Fisher’s exact test). (c) Same as (b), for strong (>10%) editing sites. (d) Box plots showing the distribution of editing levels for synonymous, restorative, and diversifying sites, per species. The boxes represent the first-to-third quartiles range, the horizontal line within the box indicates the median, and the whiskers extend to the most extreme values within a window sized 1.5 times the box size, centered at the median. P values for the difference between the editing levels of restorative and diversifying sites are indicated (Mann–Whitney test). (e) Fraction of sites edited in C1 (LCA of the six coleoids studied) that were mutated into a genomic G in at least one of the six descendant species. Significance of difference for each pair of groups is indicated (Fisher’s exact test). P values < 0.05 are marked with an asterisk. Error bars represent SEM.

