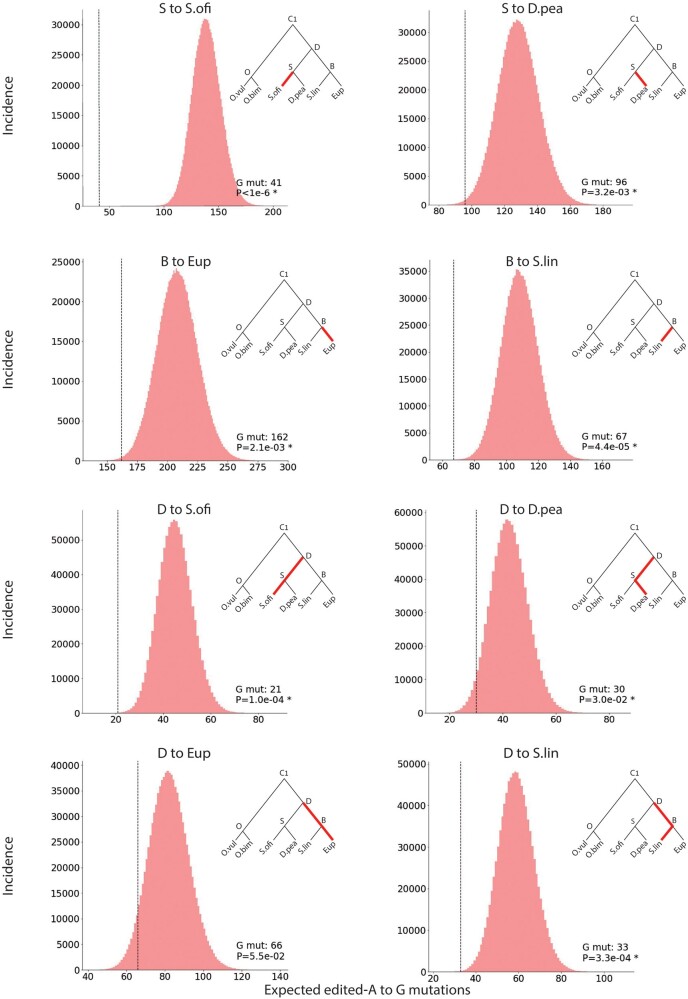
Fig. 4.
A > G mutations are depleted at strong editing sites. Panels Compare the actual numbers of A > G mutations in ancestral strongly edited sites (vertical dashed line, numbers indicated in legend) with the distributions based on HPM assumptions and background transcriptomic data. Note that the eight paths (and thus the eight statistical tests) are not independent. Distributions plotted based on 106 samples of the statistical model. Vertical axis represents the number of instances generated in the above process within each bin range. P values calculated by direct comparison with the distribution. P values < 0.05 are marked with an asterisk.

