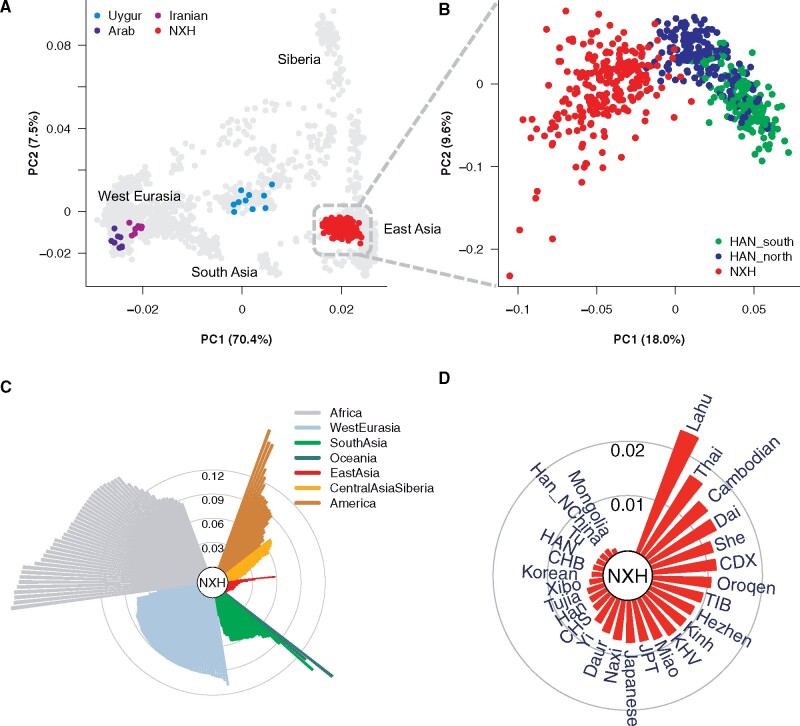
Fig. 1.
Genetic affinity of NXH in the context of worldwide populations. (A) PCA of 230 NXH samples with samples from other Eurasian populations. Geographical regions from where the samples were collected are labeled on the plot. The number in the bracket represents the variance explained by each PC accounting for the top 10 PCs. (B) PCA of 230 NXH and 341 Han Chinese samples. (C) A fan-like chart showing genetic differences (FST) between NXH and other global populations. Each branch represents one pairwise comparison between NXH and 1 of 205 worldwide populations. Lengths are proportional to FST value, which is indicated by gray circles. The populations are classified by geographical regions and indicated with colors showing in the legend. (D) A fan-like chart showing FST between NXH and East Asian populations.

