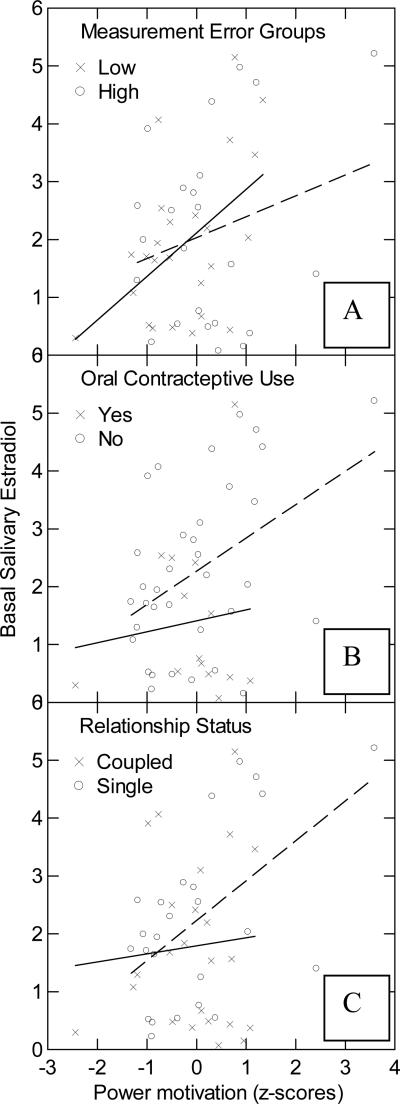
Figure 3.
Correlations between n Power and basal salivary estradiol (average of T1 and T2). Panel A depicts the correlations for groups of high (dashed line) and low (solid line) estradiol measurement error (CV). Panel B depicts the correlations for women who do (solid line) and do not (dashed line) use oral contraceptives. Panel C depicts the correlations for the single women (dashed line) and for women in close relationships (solid line).

