Figure 3.
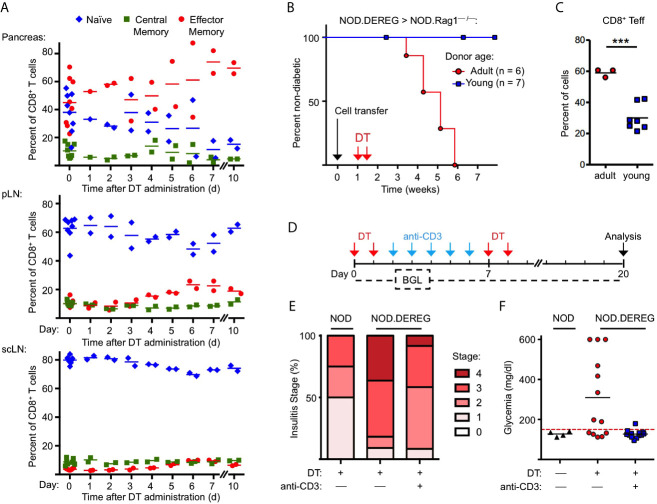
Anti-CD3 mAb therapy after Treg cell ablation ameliorates insulitis and prevents progression to hyperglycemia. (A) Kinetics of CD8+ T cells with a naïve (CD62LhighCD44low), central memory (CD62LintCD44int), and effector/memory (CD62LlowCD44high) phenotype in pancreas (top), pLN (middle), and scLN (bottom) of 10-12-week-old NOD.DEREG mice before (day 0) and at indicated days after DT administration. (B, C) Adoptive splenocyte transfer model. (B) Splenocytes from adult (16-18-week-old) but not young (4-5-week-old) DTR/GFP+ NOD.DEREG donors promote overt diabetes in NOD.RAG1–/– recipient mice after DT treatment. Black arrow indicates the day of splenocyte transfer (2 x 10⁶ total cells), and red arrows indicate the days of DT administration. (Log-Rank (Mantel-Cox) test, p = 0.0097). (C) Proportions of CD8+ T cells with a CD62LlowCD44high effector/memory phenotype in the pLN of NOD.RAG1–/– recipients of splenocytes from young (red circles) or adult (blue squares) NOD.DEREG donors. Unpaired t-test: ***p < 0.001. (D–F) anti-CD3 mAb treatment of Treg cell-depleted NOD.DEREG mice. (D) Scheme of experimental design. Cohorts of adult NOD.DEREG females were injected with DT only (n = 13), or were additionally treated with anti-CD3 mAb (n = 13). Untreated DTR/GFP– NOD.DEREG mice were included for comparison (n = 4). Arrows: red, DT injection; blue, anti-CD3 injection; black, analysis by histology and flow cytometry. Blood glucose concentrations were assessed before (day 0) and every second day after the first injection with DT until the end of the observation period on day 14. (E) Histological insulitis score of indicated experimental groups, and (F) blood glucose levels of individual mice (one-way ANOVA: p ≤ 0.01). Each symbol in (A, C, F) corresponds to an individual mouse.

