Figure 3.

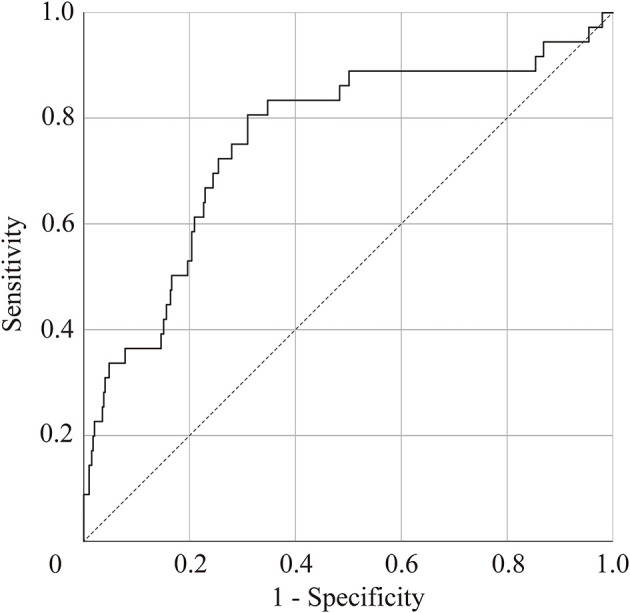
Receiver-operator curve (ROC) to predict patients with major depressive disorder. Area under the ROC = 0.76 (standard error = 0.05, p = 1.2 × 10⁻⁷, 95% confidence interval, 0.67–0.85).

Receiver-operator curve (ROC) to predict patients with major depressive disorder. Area under the ROC = 0.76 (standard error = 0.05, p = 1.2 × 10⁻⁷, 95% confidence interval, 0.67–0.85).