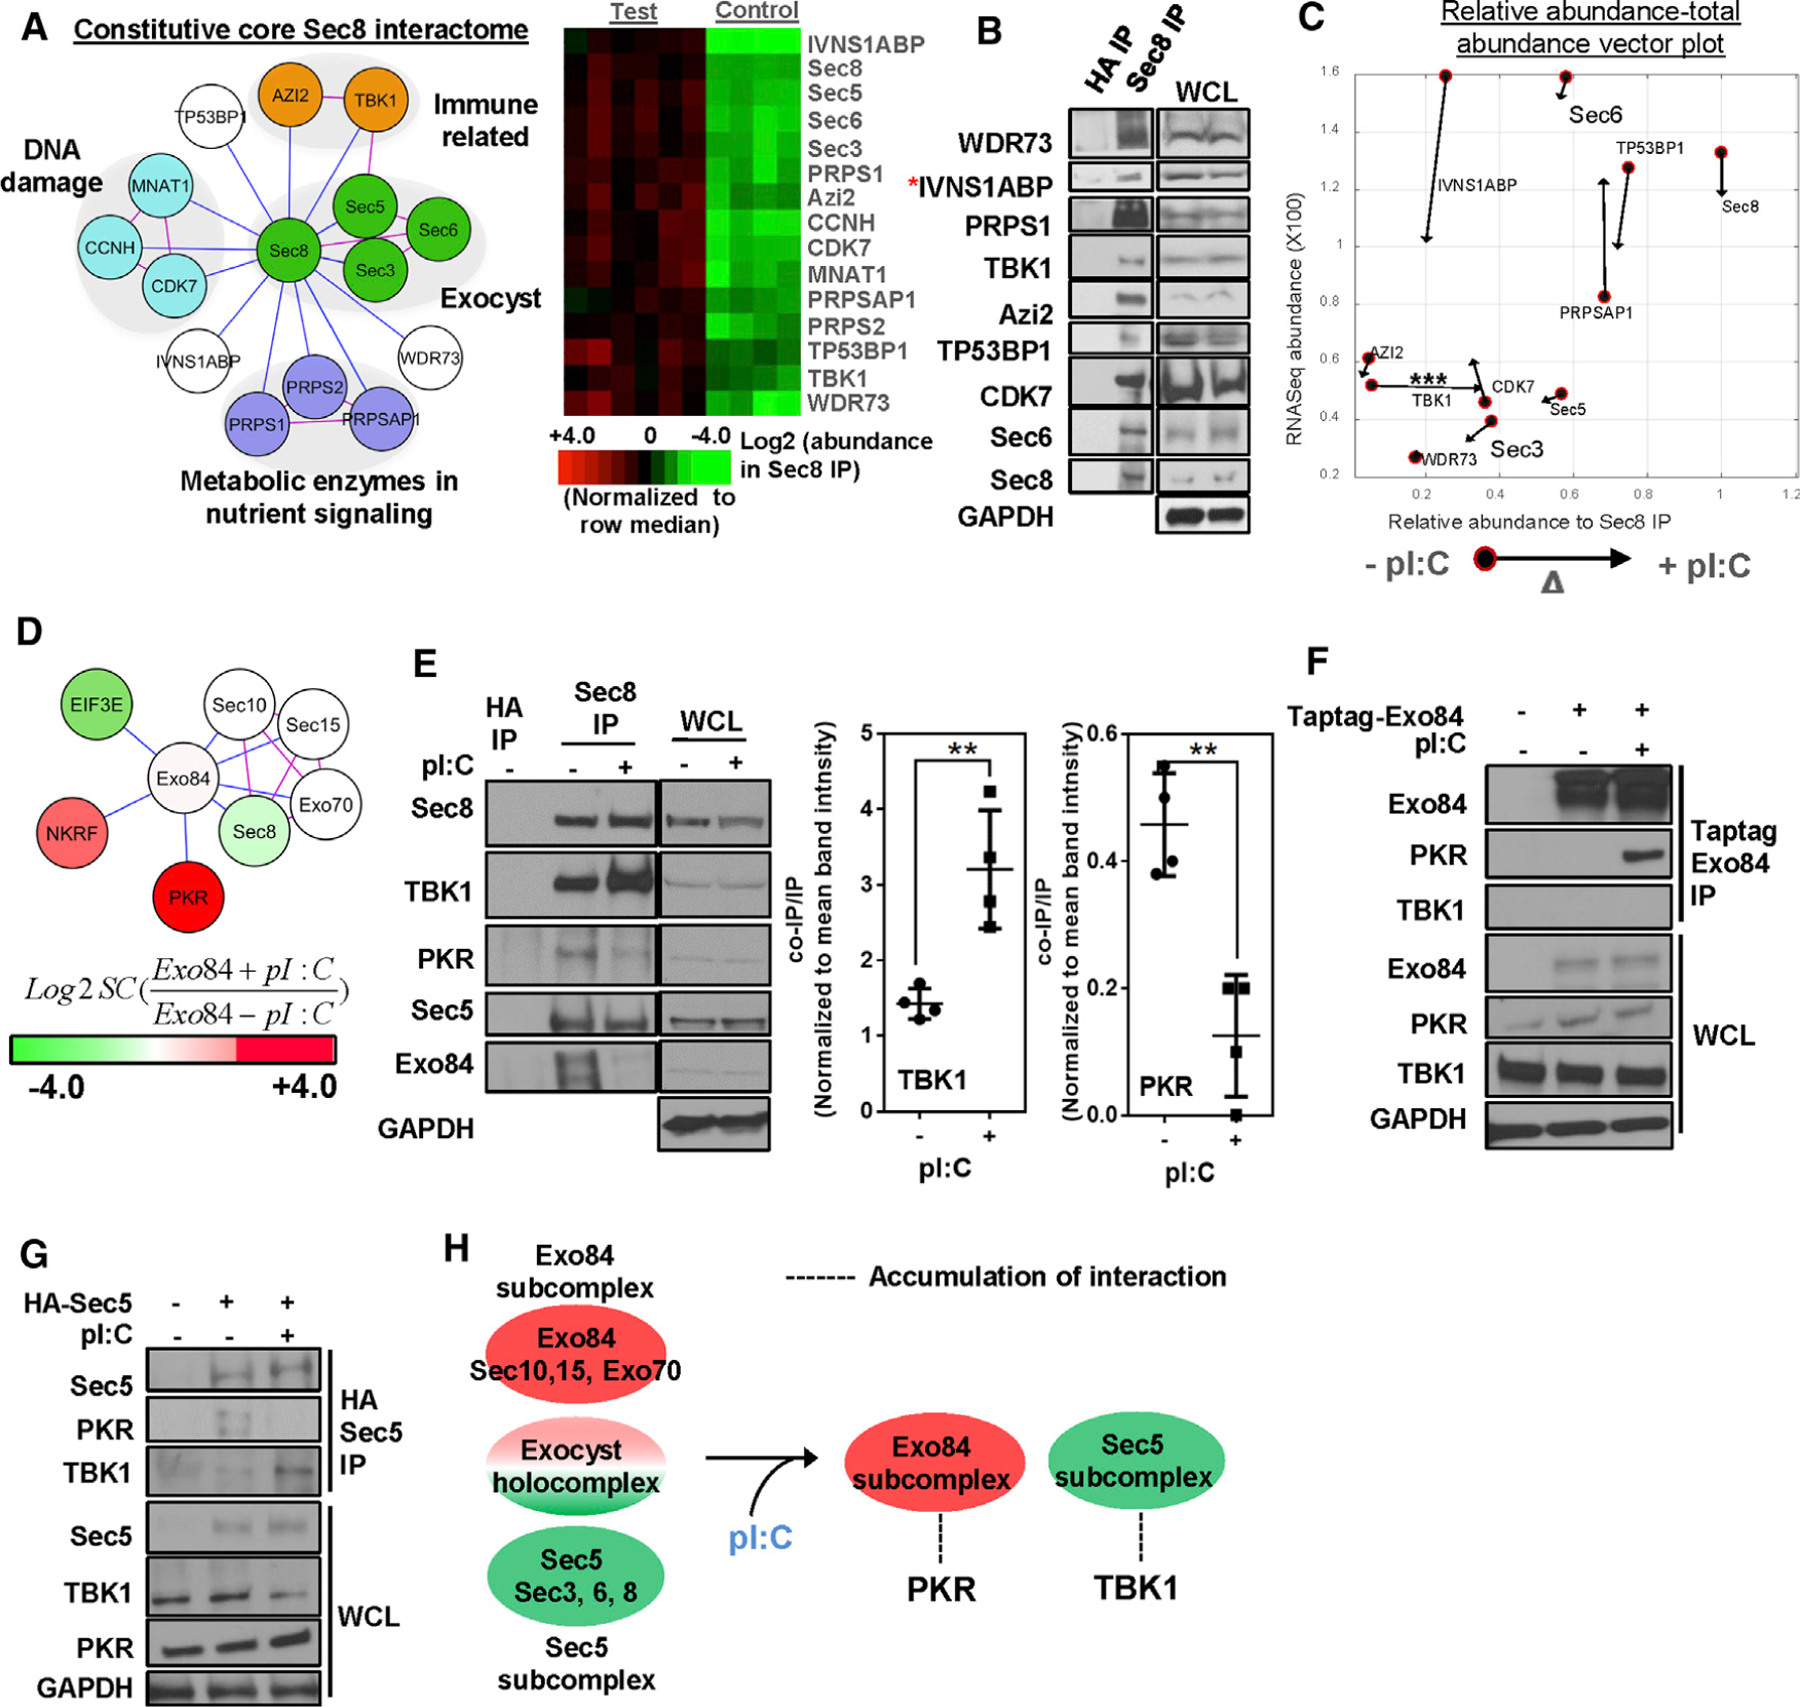
Figure 1. Static and dynamic exocyst complexes.

(A) Sec8 endogenous interactome. (Left) Nodes represent proteins, blue edges represent experimentally observed interactions, and pink edges represent known interaction imported from the curated BIOGRID database. Gene functions are labeled as reported in STRING and GO databases. (Right) Heatmaps represent intensity profiles (row median normalized) of the indicated proteins. Test IP: n = 20; control IP: n = 12).
(B) Western blot validation of Sec8 interactome. Asterisk indicates the presence in CRAPOME database (n = 3).
(C) Stimulus-dependent effects on Sec8 interactome. Poly(I:C) challenge-specific relative abundance versus total abundance vector plot of core Sec8 complex members is shown. Filled circles indicate pre-stimulus values, and arrowheads indicate post-stimulus values. Statistical significance for TBK1 enrichment is indicated (***p < 0.005, unpaired Student’s t test).
(D) Exo84 interactome. HEK293T cells overexpressing tagged Exo84 were immunoprecipitated with or without of poly(I:C) and were analyzed for coimmunoprecipitation of proteins using LC-MS. Node color indicates hit abundance with or without (+/−) poly(I:C), and edge color is coded as in (A) (n = 3).
(E) Sec8 interactions with immune signaling kinases PKR and TBK1. Endogenous Sec8 from HEK293T cells was immunoprecipitated with or without poly(I:C) and was evaluated by SDS-PAGE. For statistical significance (unpaired Student’s t test) for quantified band intensities, **p < 0.01 (n = 4).
(F and G) Exo84 and Sec5 interactions with PKR and TBK1. (F) Epitope-specific immunoprecipitates were evaluated for coimmunoprecipitation in Taptag-Exo84 and (G) HA-Sec5-expressing HEK293T cells with or without poly(I:C) (n = 3).
(H) Schematic summary of dynamic exocyst subcomplex partners upon poly(I:C) challenge.
