FIGURE 1.
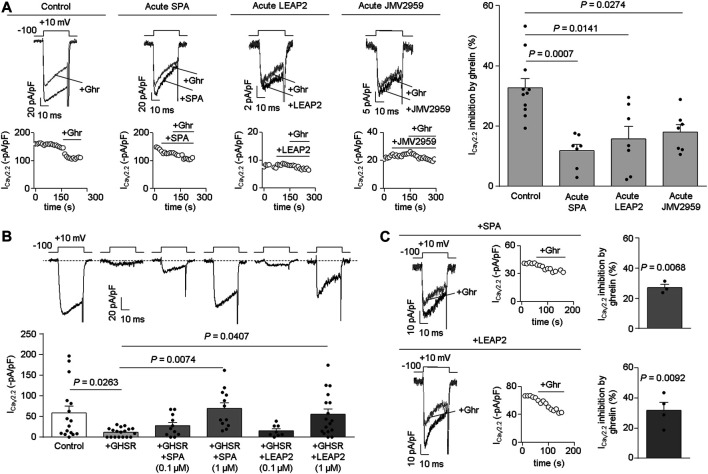
Acute LEAP2 reduces ghrelin-dependent and -independent effects of GHSR on CaV2.2 currents. (A) Representative traces and time courses (left) of CaV2.2 current (ICaV2.2) from HEK293T cells cotransfected with CaV2.2, CaVβ3, CaVα2δ1 and GHSR in 0.1 GHSR:CaV2.2 molar ratio in control condition and ghrelin (+Ghr) application (Control, n = 11); or consecutive SPA and ghrelin application (Acute SPA, n = 7); or consecutive LEAP2 and ghrelin application (Acute LEAP2, n = 7); or consecutive JMV2959 and ghrelin application (Acute JMV2959, n = 7). Bars (right) represent averaged ICaV2.2 inhibition by 0.5 µM ghrelin application for each condition. Statistical significance was evaluated by Kruskal-Wallis and Dunn’s post-test (vs. Control). (B) Representative traces (top left) of CaV2.2 current (ICaV2.2) from HEK293T cells cotransfected with CaV2.2, CaVβ3, CaVα2δ1 and, empty pcDNA3.1 (Control, n = 16) or GHSR in 0.6 GHSR:CaV2.2 molar ratio (+GHSR, n = 18), pre-incubated or not with 0.1 µM or 1 µM of SPA [+GHSR +SPA (0.1 µM), n = 11; +GHSR +SPA (1 µM), n = 12], or 0.1 µM or 1 µM of LEAP2 [+GHSR +LEAP2 (0.1 µM), n = 8; +GHSR+ LEAP2 (1 µM), n = 17] during 20 h. Bars (bottom left) represent averaged ICaV2.2 levels for each condition. Statistical significance was evaluated by One Way ANOVA and Tukey’s post-test. (C) Representative traces and time courses of ICaV2.2 from HEK293T cells cotransfected with CaV2.2, CaVβ3, CaVα2δ1 and GHSR in 0.6 GHSR:CaV2.2 molar ratio pre-incubated with 1 µM of SPA (top right) or with 1 µM of LEAP2 (bottom right) during 20 h. Ghrelin was applied after washing SPA (SPA, n = 3) or LEAP2 (LEAP2, n = 4). Bars represent averaged ICaV2.2 inhibition by 0.5 µM ghrelin application for each condition. Statistical significance was evaluated by One-Sample Student’s t test, test value = 0. The test-pulse protocol consisted in square pulses applied from −100 to +10 mV for 30 ms every 10 s.

