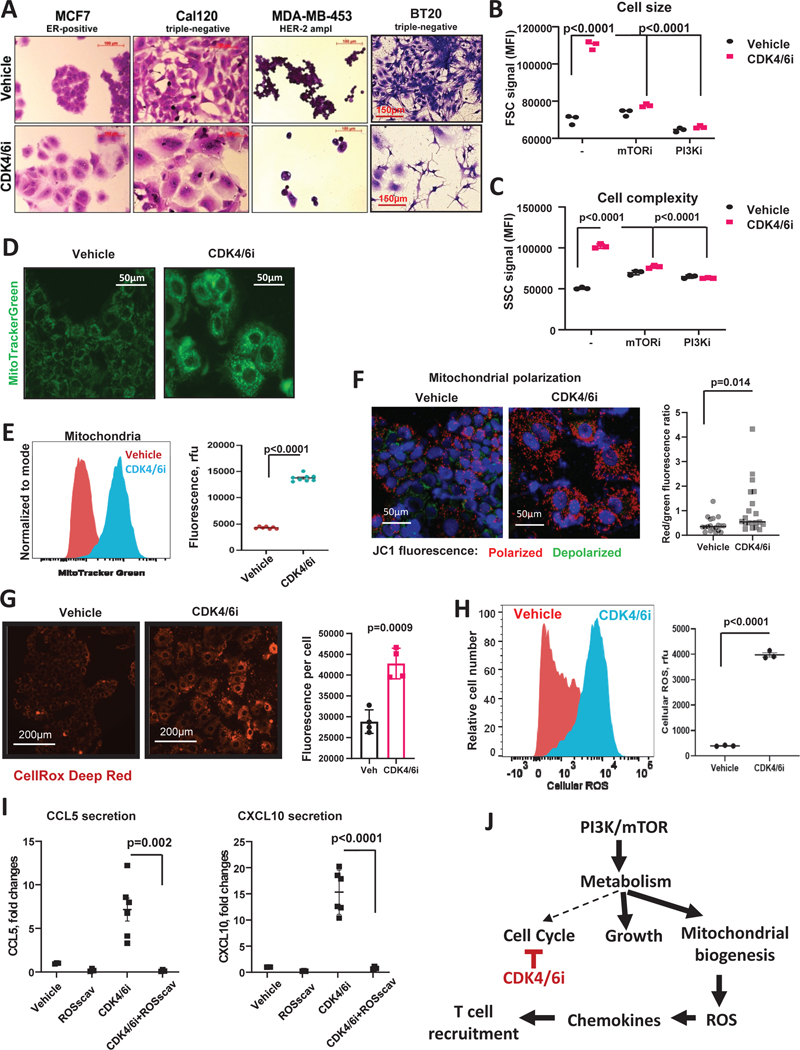
Figure 5. CDK4/6i-mediated chemokine production is associated with cell hypertrophy, accumulation of mitochondria, and induction of ROS.
A. Microscopic images of crystal violet stained cells that were treated for 5 days with 5μM of palbociclib, except for BT20, which were treated with 1 μM palbociclib. B. Flow cytometry measurement of forward-scattered light (FCS) parameter indicative of cell volume. MCF7 cells treated with vehicle or 1 μM palbociclib ± 2 μM mTORi rapamycin, or 0.5 μM of PI3Ki BKM120 (buparlisib) for 5 days (n=3, one-way ANOVA, data are presented as individual values and mean). C. Same as F, except side-scattered light (SSC) channel signals indicative of cell complexity (presence of granules and organelles) are shown. D. Fluorescent microscopy of mitochondria detected with MitoTracker Green in MCF7 cells treated with vehicle or 5μM CDK4/6i palbociclib for 5 days. E. Quantification of the MitoTracker staining shown in D using flow cytometry (n=6–8, one-way ANOVA, data are presented as individual values and mean). F. Mitochodrial potential analysis using JC-1 biosensor. Red punctate signal – aggregates of JC-1 in polarized mitochondria, green cytoplasmic staining – free JC-1 monomers. Random microscopic fields from 4 biological replicates quantified with ImageJ (n=19–20, t-test, data are presented as individual values and mean). G. Representative fluorescence microscopy images of cellular ROS detected with CellROX Deep Red in MCF7 cells treated with vehicle or 5μM palbociclib (CDK4/6i) for 5 days. Right panel shows average values of ROS fluorescence per cell from 4 biological replicates compared using t-test. Data are presented as individual values, mean ± SD. H. Representative histogram (left panel) from flow cytometry analysis of cellular ROS in MCF7 cells treated with vehicle or 5μM CDK4/6i palbociclib for 5 days. Right panel shows quantified data (n=3, t-test, data are presented as individual values, mean ± SEM). I. Levels of chemokines CCL5 and CXCL10 in the conditioned media from MCF7 cells treated with 5 mM of cellular ROS scavenger NAC, CDK4/6i (5μM), combination of both, or vehicle for 5 days (n=4–6, one-way ANOVA, data are presented as individual values, mean ± SEM). J. Proposed model CDK4/6i-mediated chemokine induction. Briefly, PI3K/mTOR pathway remains active in CDK4/6i-treated cells despite the decreased metabolic demands due to the cell cycle arrest. This leads to exacerbated cell growth and mitochondrial levels and activity associated with oxidative stress, which, in turn, promotes production of T cell-recruiting chemokines.

