
Fig 3.
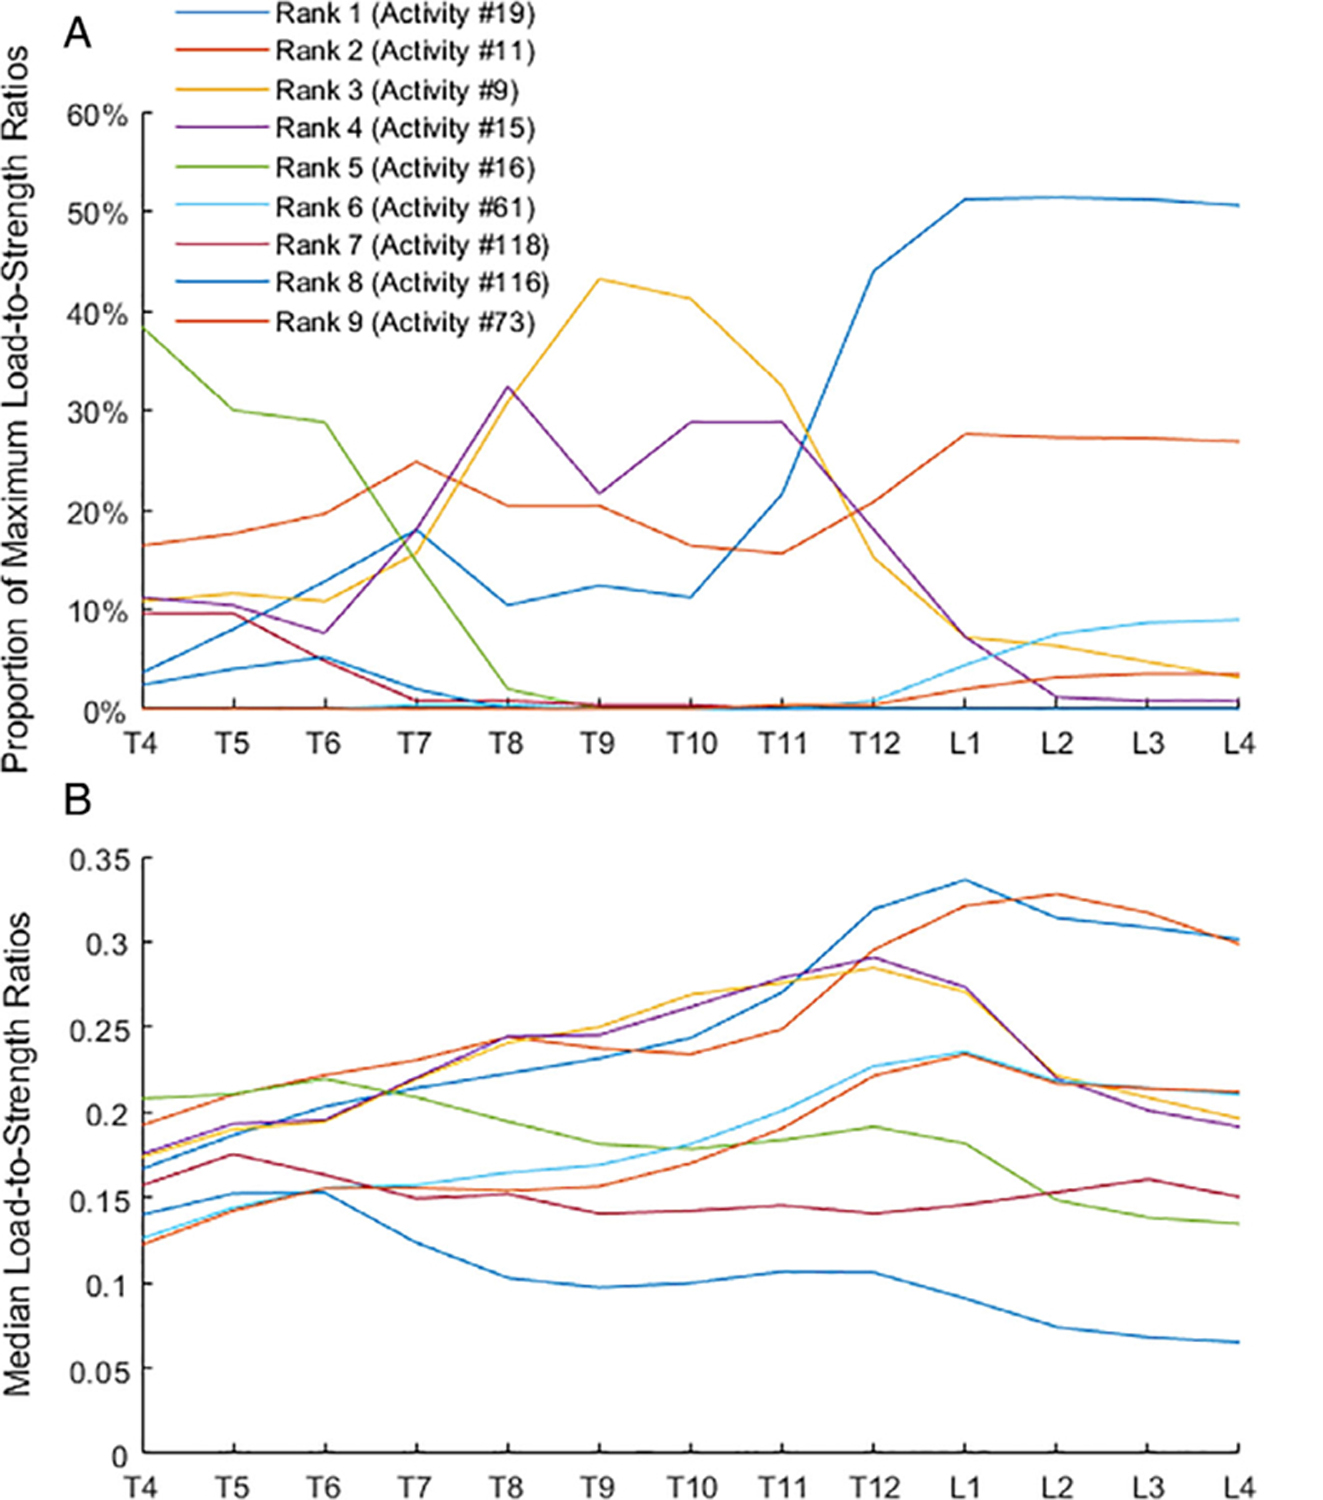
The proportion (%) of maximum load-to-strength ratios at each vertebral level (A) and median values of load-to-strength ratios (B) for nine key activities producing maximum load-to-strength ratios. These nine activities produced 95.8% of the maximum load-to-strength ratios overall among 109 activities examined and at least 89.6% at each vertebral level.