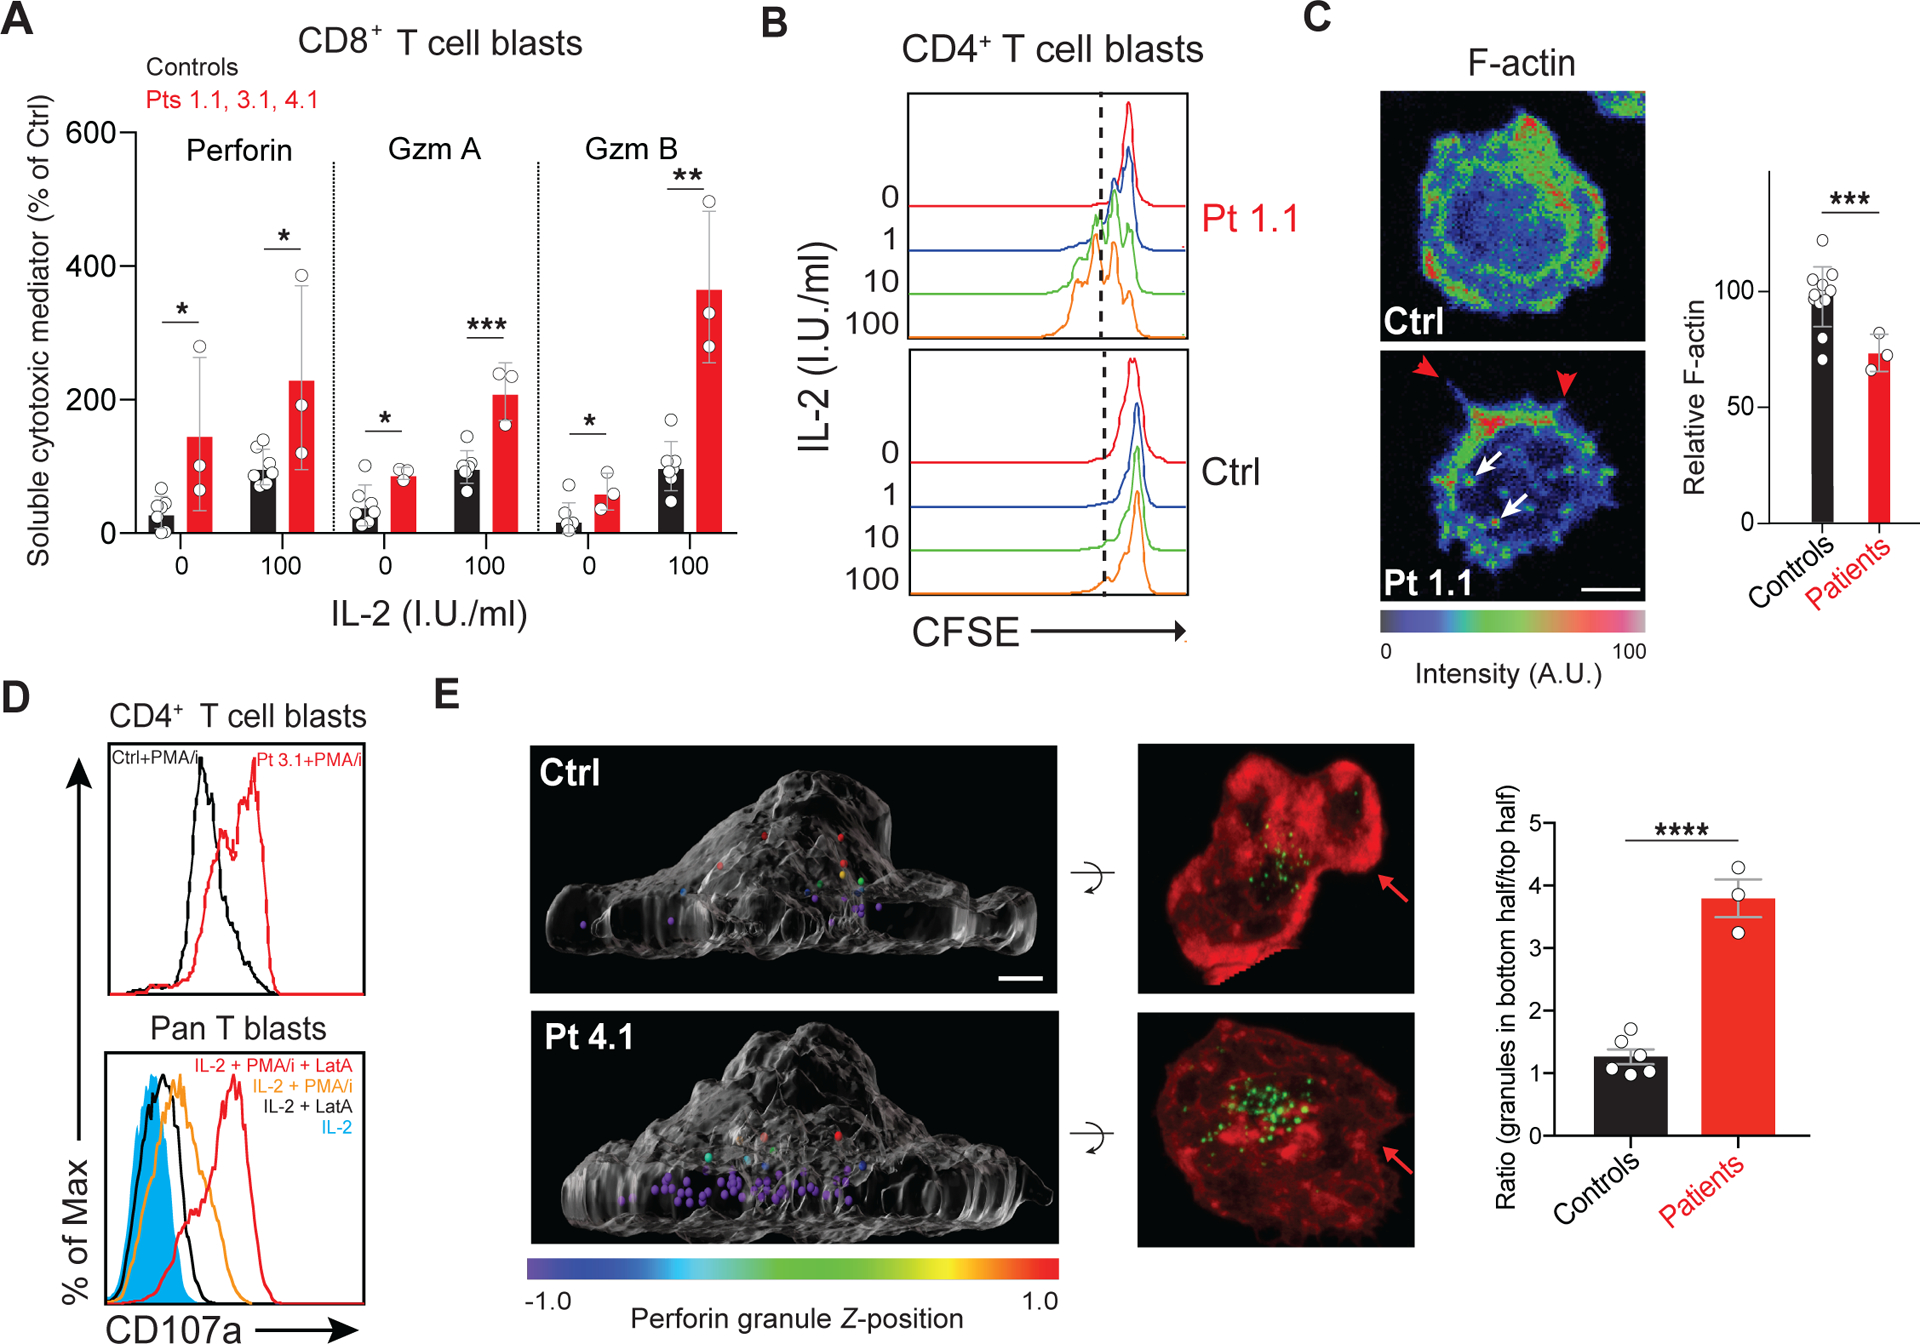
Figure 2. HEM1 is essential for regulating cortical actin and granule release.

(A) Release of granzymes (Gzm) A and B or perforin from Pt or control (Ctrl) CD8+ T cell blasts following 18-hours of IL-2 stimulation in international units (I.U.) in three independent experiments. (B) Flow cytometric histograms measuring proliferation of rested CD4+ T cell blasts from a normal control (Ctrl) or Patient 1.1 (Pt 1.1) measured by carboxyfluorescein succinimidyl ester (CFSE) dilution after IL-2 restimulation for 96 hours. (C) Ctrl or Pt 1.1 CD4+ T cell blasts spreading on coverslips coated with anti-CD3, anti-CD28, and ICAM-1 (1 μg/ml each), stained with phalloidin, and pseudo-colored for F-actin (left). F-actin was quantified in three experiments (right). Red arrows: formin-mediated spikes; white arrows: WASp-mediated actin puncta. Scale bar: 4 μm. (D) Surface CD107a on Ctrl and Pt 3.1 CD4 T cell blasts following 1-hour phorbol myristate acetate (PMA)/ionomycin (I) stimulation (top) or stimulated pan T cells with 1 μM latrunculin A (LatA) (bottom). (E) Side view of perforin granules pseudo-colored by Z-position relative to the cell center in Ctrl or Pt 1.1 CD8+ T cell blasts (left). Corresponding 90° forward rotation top views of F-actin (red) and perforin (green) (middle). Red arrows: lamellipodial F-actin density. Scale bar: 2 μm. Mean ratios of granules in the bottom half to top half of the cell, quantified in at least 30 cells per sample (right). Bars represent mean ± SEM (control n = 6, patient n = 3). Data represent at least three repeat experiments. Statistical analyses for (A), (C), and (E) were performed using a t-test without assuming equal variance. [P ≤ 0.05, **P ≤ 0.01, ***P ≤ 0.001.]
