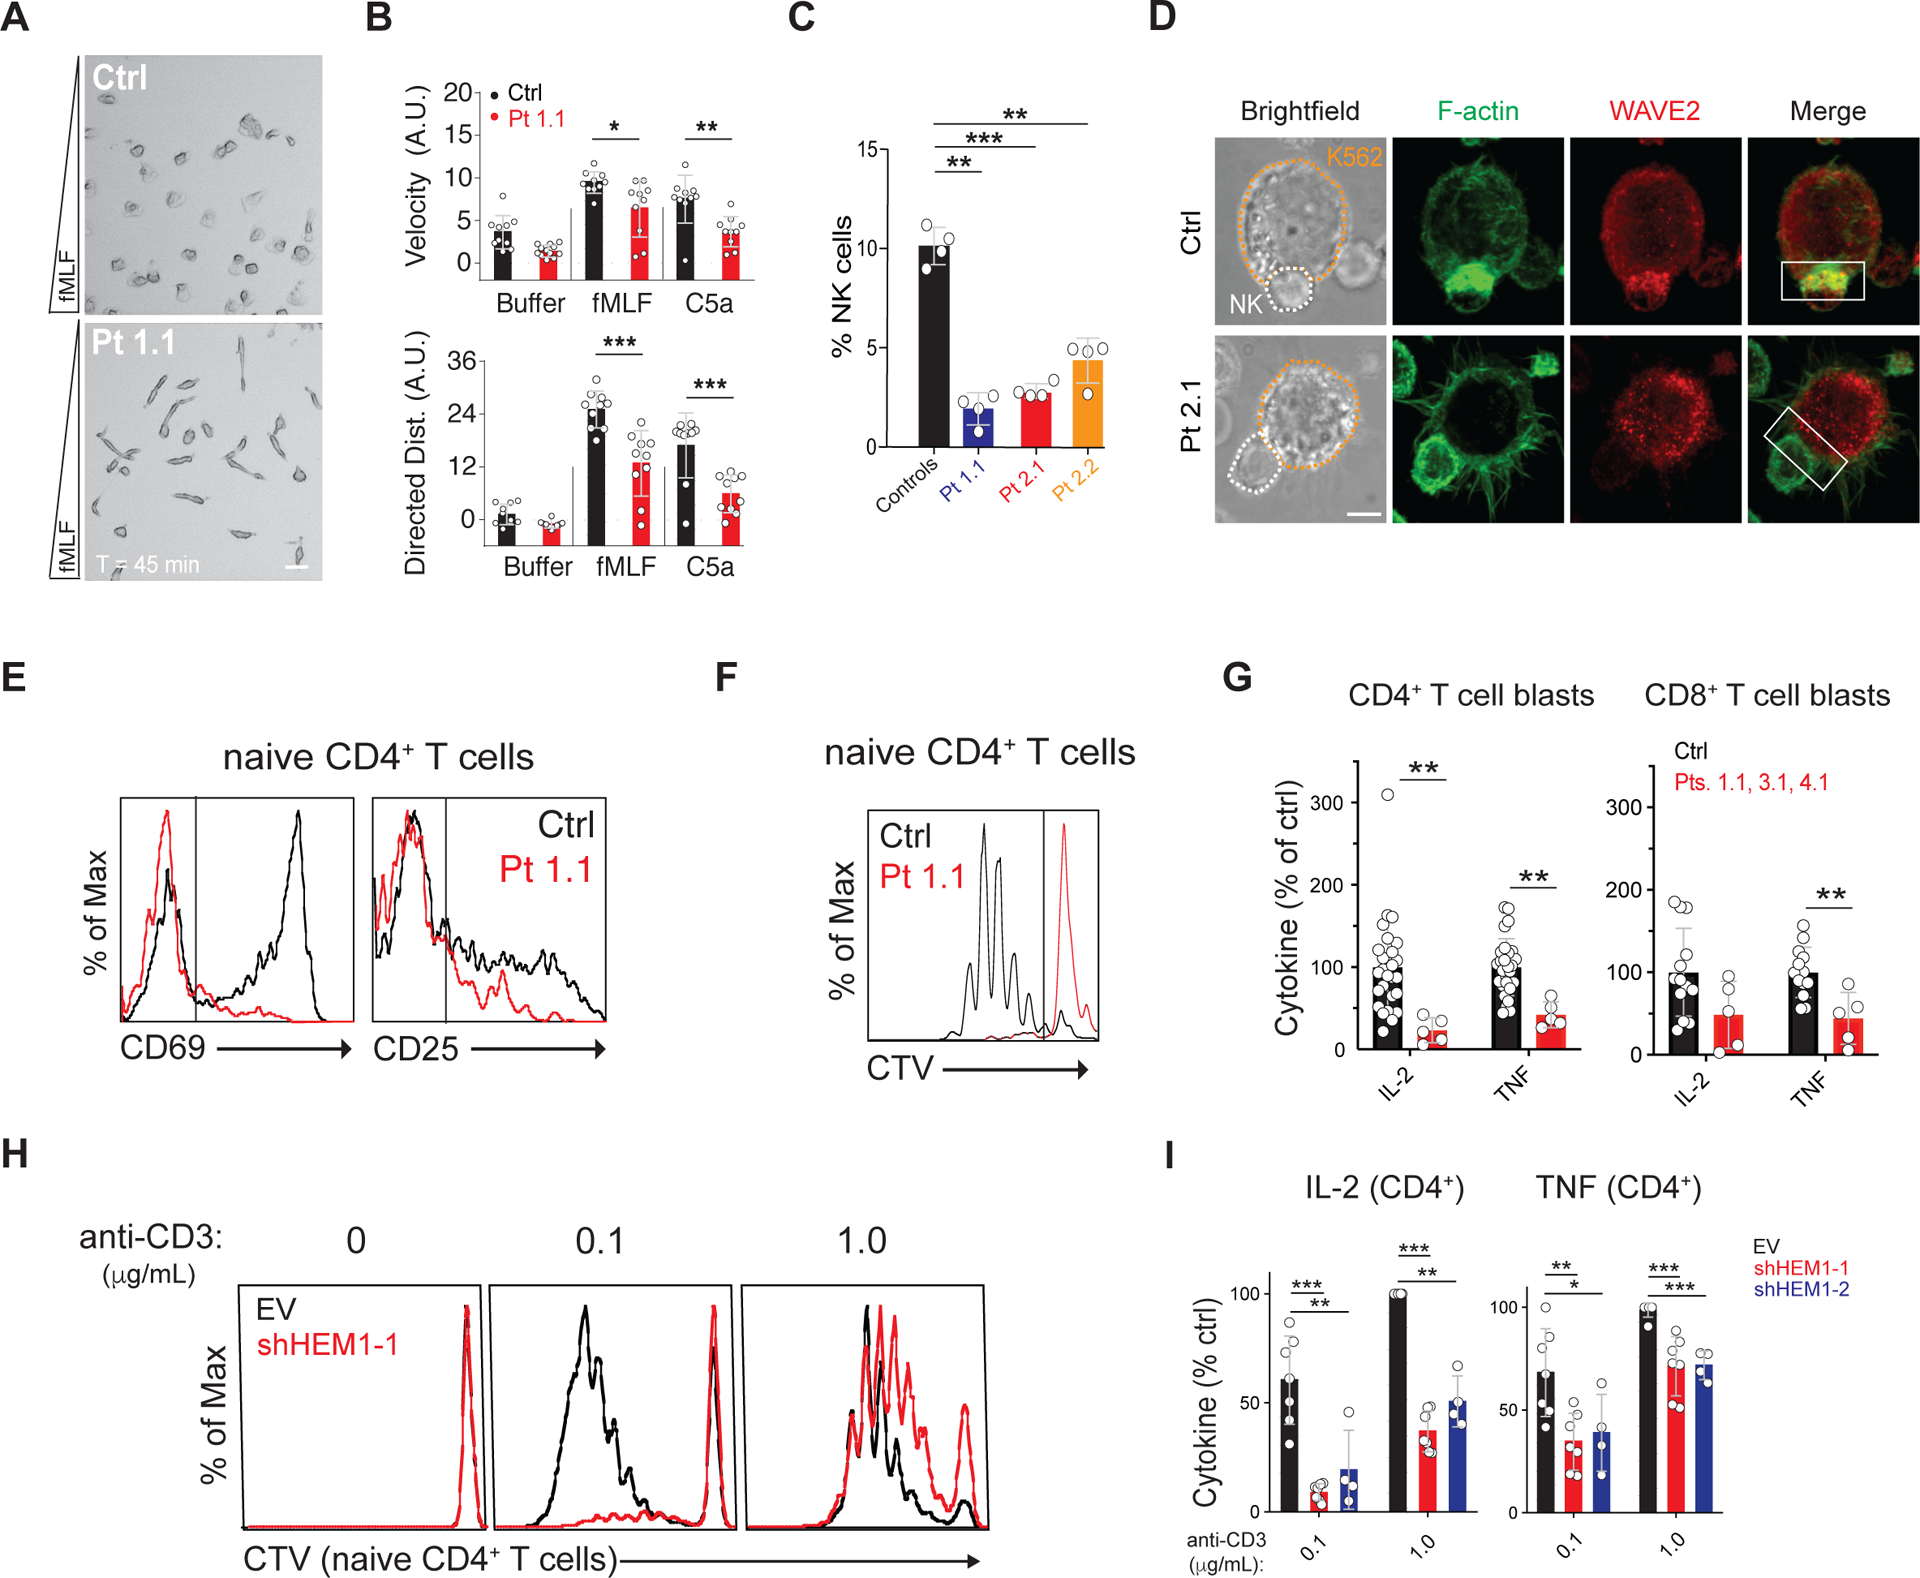
Figure 3. HEM1 loss causes immunodeficiency by abnormal immune cell behavior and activation.

(A) Single frame from movie S4 showing healthy control (Ctrl) or Pt 1.1 neutrophils migrating in a gradient (bottom = greatest concentration) of N-formyl-L-methionyl-L-leucyl-L-phenylalanine (fMLF). Scale bar: 20 μm. (B) Displacement velocity (top) and net directed distance (Dist.)(bottom) in arbitrary units (A.U.) of ten randomly selected Ctrl or Pt 1.1 neutrophils migrating in chemoattractant gradients. (C) Percentage of NK cells in four peripheral blood samples. (D) Photomicrographs of immunological synapses between K562 target cells (orange outline) and NK cells (white outline) stained with phalloidin for F-actin and WAVE2 antibody. White box: area of synapse. Scale bar: 5 μm. (E) CD69 and CD25 upregulation on Ctrl or Pt 1.1 naïve CD4+ T cells after stimulation with immobilized anti-CD3/28 (1 μg/ml each). (F) Cell Trace Violet (CTV) proliferation plots of cells as in (E) stimulated for 5 days. (G) IL-2 and TNF secretion by CD4+ or CD8+ T cell blasts after restimulation for 36 hours with immobilized anti-CD3/28 and ICAM-1 (1 μg/ml each) in three independent experiments. (H) CTV plots of naive CD4+ T cells transduced with empty vector (EV) or small hairpin RNA against HEM1 (sh-HEM1) stimulated on immobilized ICAM-1/anti-CD28 (1 μg/ml each) and the indicated dose of anti-CD3. (I) IL-2 and TNF secretion by CD4+ T cell blasts transduced with empty vector (EV) or shRNAs targeting HEM1 (sh-HEM1–1 and sh-HEM1–2) and stimulated as in (H). Neutrophil migration was analyzed for two independent donors, otherwise data represent at least four independent trials of each assay. Statistical analyses for (B), (C), and (G) was performed using a t-test without assuming equal variance. Statistical analysis for (I) was performed using a Wilcoxon matched-pairs signed-rank test. [*P ≤ 0.05, **P ≤ 0.01, ***P ≤ 0.001.]
