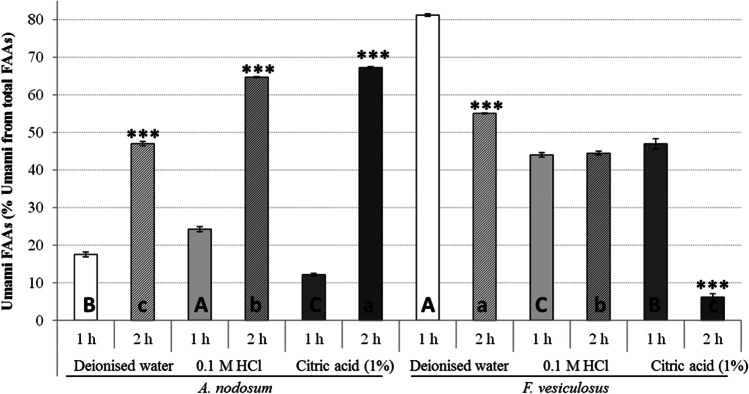
Fig. 2.
Bar charts representing the influence of solvent type (deionised water, 0.1 M HCl and 1% citric acid) and extraction time (1 and 2 h) on the % umami FAAs extracted from A. nodosum and F. vesiculosus. Results are expressed as average ± standard deviation of the mean. Different letters indicate statistical differences in the % of umami FAAs extracted using multiple solvents during 1 h (uppercase letters) or 2 h (lowercase letters). The statistical differences in the % of umami amino acids extracted by using different times of extraction and the same solvent are represented as: *P < 0.05, **P < 0.01 and ***P < 0.001

