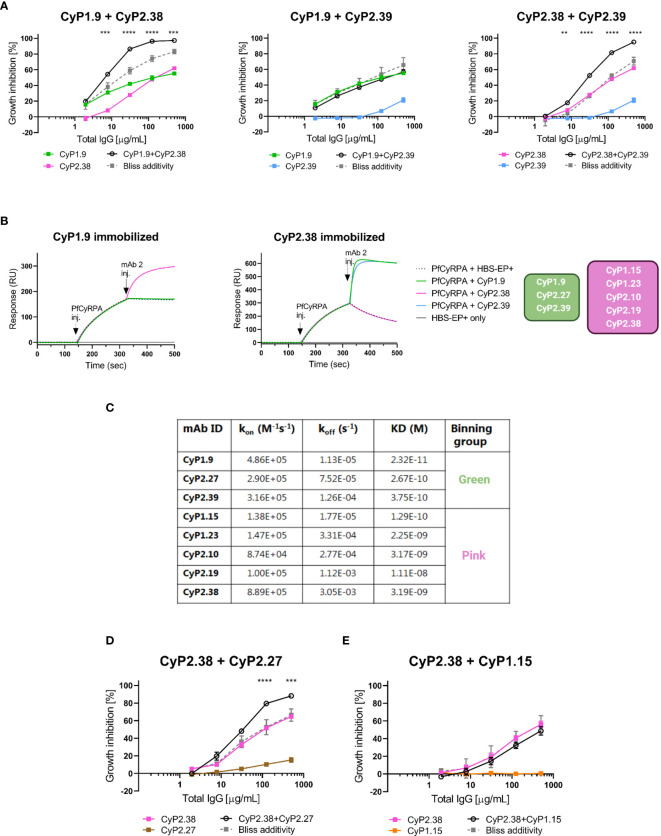
Figure 2.
Association between growth inhibition activities of anti-PfCyRPA mAb combinations and binding site on PfCyRPA. (A) GIA assays using dilution series of individual mAbs and 1:1 combination of anti-PfCyRPA mAbs on 3D7 reference strain. Theoretical additive effects were calculated using Bliss additivity (described in Materials and Methods) and shown in the grey dotted line on each graph. A solid black line represents the experimental effect of mixing two anti-PfCyRPA mAbs. Data points represent the mean of triplicates from two independent experiments. Error bars show SEM for all six replicates over two experiments. The asterisks indicate where the experimental and predicted values of the mAb combination significantly show synergy, using a 2-way ANOVA with Bonferroni’s multiple comparison test (**p,0.01, ***p,0.001, ****p,0.0001). (B) Sensorgrams of epitope-binning experiments by classical sandwich blocking using SPR systems. The two most potent anti-PfCyRPA mAbs have been immobilized onto the surface of a CM5 chip, with one mAb in one flow cell. The first injection is the PfCyRPA antigen and the second injection is the competing mAb with both injections indicated by an arrow. An increment in RU at the second injection site is indicative of a non-competing mAb. (C) Kinetic properties of the panel of PfCyRPA mAbs in relation to epitope-binning group. Association-rate (kon), dissociation-rate (koff) and dissociation constant (KD) are listed. (D) GIA assay using CyP2.38 in combination with non-inhibitory mAbs from different or (E) same binning groups. Asterisks indicate where the experimental and predicted values of the mAb combinations are significantly different.

