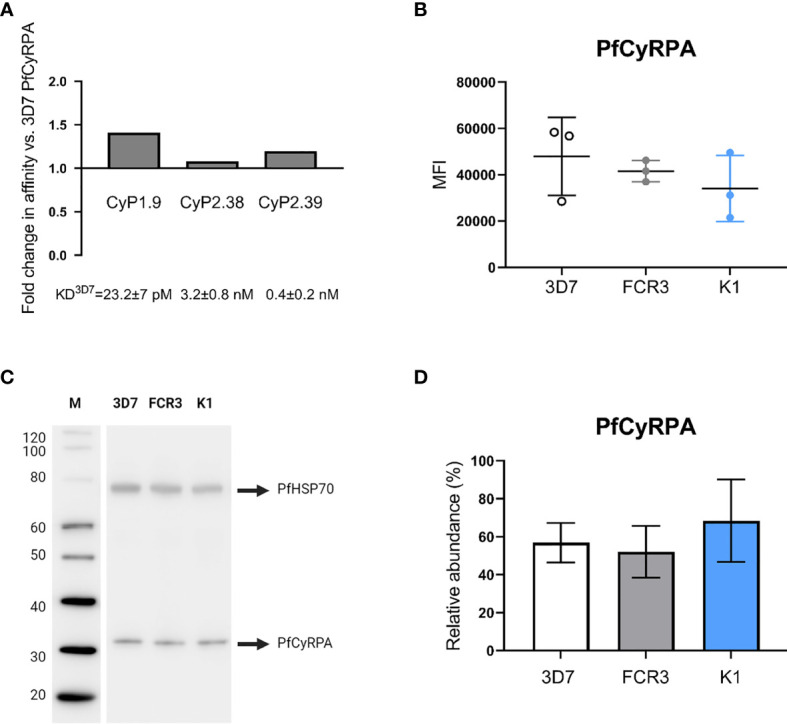
Figure 7.

Binding to PfCyRPA (R339S) variant and endogenous expression level of PfCyRPA in three P. falciparum strains. (A) Real-time analysis by SPR of anti-PfCyRPA mAbs binding to PfCyRPA variant with the most common naturally occurring amino acid substitution R339S. The error bars show fold-change in affinity compared to 3D7 reference sequence PfCyRPA. (B) Intracellular detection of PfCyRPA analyzed by flow cytometry on fixed and permeabilized merozoites (3D7, FCR3 and K1). The merozoites were stained with the primary mAb (CyP1.9) and the secondary mAb (horse anti-mouse IgG conjugated to FITC) as well as the nuclei stain DAPI. In the scatter plot, each dot represents the geometric MFI in the FITC channel from an independent experiment, repeated on each strain three times. The mean and the SD are shown in the scatter plot. A one-way ANOVA with Tukey’s multiple comparison test was applied to determine if there was any significant difference in the expression level of PfCyRPA between the three strains. (C) Western blot of 3D7, FCR3 and K1 merozoite lysates (10 µg lysate per lane) showing staining of PfCyRPA using CyP1.9 and PfHSP70 (loading ctrl) using a rabbit anti-P. falciparum HSP70 polyclonal Ab. (D) Quantitative analysis of PfCyRPA amounts from two independent blots, each strain was added in triplicate on each blot. Error bars represent SD from two independent quantitated immunoblots using different batches of merozoite lysates. A one-way ANOVA with Tukey’s multiple comparison test was applied to determine if there were any significant difference in the expression level of PfCyRPA between the three strains.
