FIGURE 1.
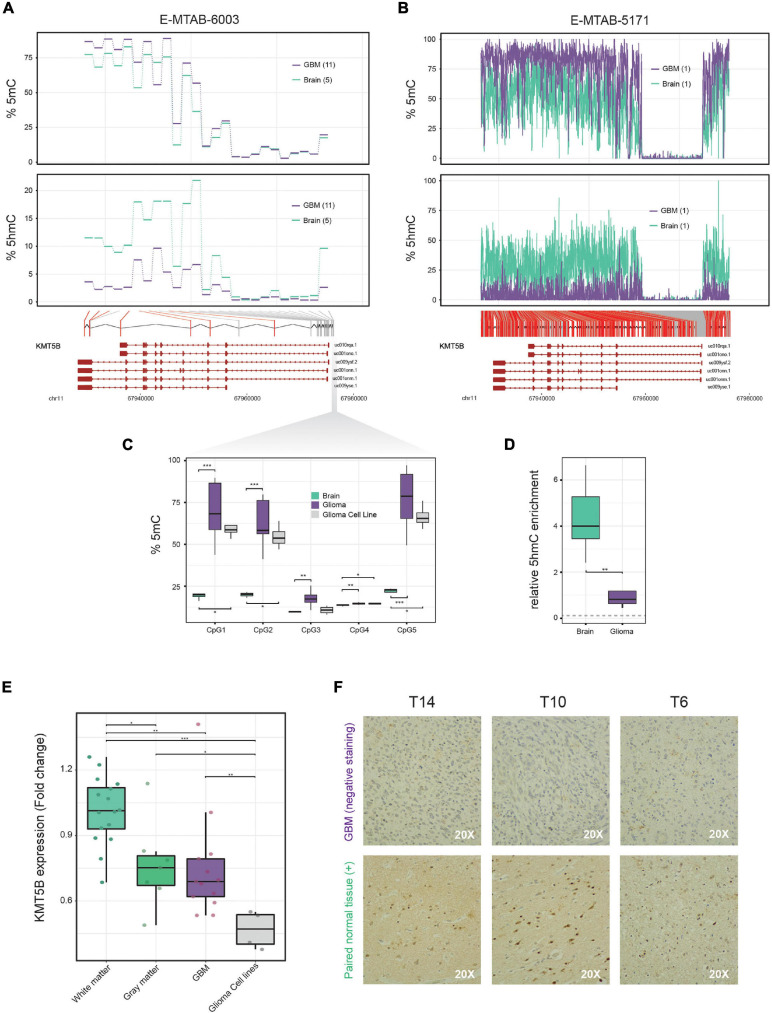
5mC and 5hmC profiling along the KMT5B locus in brain and glioblastoma multiforme (GBM) samples and analysis of KMT5B expression in brain, GBM and GBM cell lines. (A) Line plots represent percentage of average 5mC (upper panel) and 5hmC values (lower panel) corresponding to 25 CpG positions in the KMT5B gene for five control brain and eleven GBM samples, depicted in blue and violet, respectively. Data were obtained from a genome-wide Illumina HumanMethylation 450 K array (E-MTAB-6003). Welch t-tests were applied for each CpG and those that were significant are depicted in red (q-value < 0.05). (B) WGBS dataset with high content profiling of 5mC and 5hmC (accession number E-MTAB-5171) confirmed the altered 5mC/5hmC pattern of KMT5B. CpGs depicted in red represent those with changes = 15%. Lower diagrams in panels (A,B) represent the relative location of the analyzed CpG sites along KMT5B locus. (C,D) Biological validation of the methylation and hydroxymethylation values in five KMT5B promoter CpGs using, respectively, bisulfite pyrosequencing and hMeDIP. The gray dotted line in panel (D) indicates 5hmC levels in GBM cell line LN-229. Wilcoxon rank sum tests were applied (*p < 0.05; **p < 0.01; ***p < 0.001). (E) Box plot represents KMT5B mRNA relative expression in 16 white matter and 7 gray matter control brains, 13 GBM samples and 4 GBM cell lines, measured by qRT-PCR in relation to GAPDH and represented as Fold Change relative to white-matter control brains. Wilcoxon rank sum tests were applied (*p < 0.05; **p < 0.01; ***p < 0.001). (F) Representative images of KMT5B protein levels detected in GBM samples and their paired non-tumoral brain tissue by immunohistochemistry (IHC), shown at 20× magnification. Only non-tumoral brain sections showed positive KMT5B nuclear staining.

