FIGURE 3.
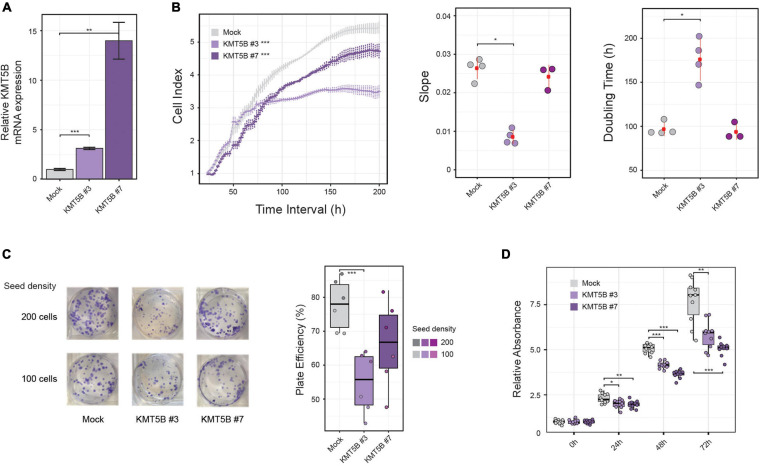
In vitro effect of KMT5B ectopic expression. Human GBM cell line LN-229 was transfected with an empty (control) or a KMT5B expression vector. (A) Stable transfectants were obtained after selection with 1 mg/mL G-418, and named mock, KMT5B #3, and KMT5B #7. KMT5B expression was confirmed by qRT-PCR (the data shown are the average ±SEM of three independent experiments. Welch t-test; **p < 0.01; ***p < 0.001). (B) The proliferation rate of mock and the two KMT5B stably-transfected clones was measured by an impedance-based assay and represented as cell index units [General linear model (GLM) ***p-value < 0.001], slope and doubling time for three to four technical replicates (Wilcoxon rank sum tests; *p-value < 0.05). (C) On the left, representative image of plates showing colony formation assay. Experiments were done in triplicate for each clone and seeding density. Results are represented in the box plot on the right as plate efficiency (Wilcoxon rank sum tests; ***p-value < 0.001). (D) Cell viability was determined by MTT assay on control and KMT5B transfected cells. Box plot represents the average absorbance of ten replicates at several time points, relative to the absorbance at time 0 h for each clone (Wilcoxon rank sum test; *p < 0.05; **p < 0.01; ***p < 0.001).

