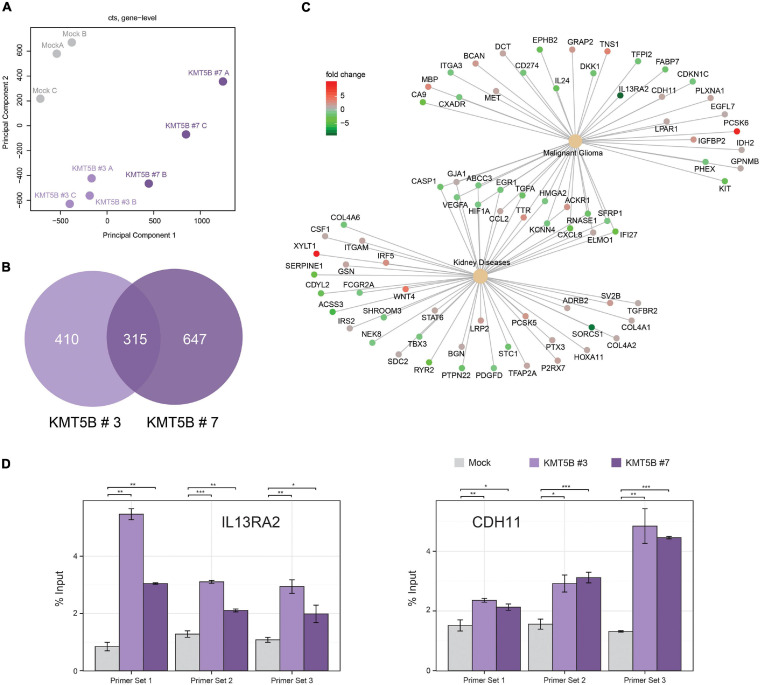
FIGURE 6.
Overexpression of KMT5B alters the expression of several genes, including IL13RA2. (A) Principal component analysis of the three replicates of each clone subjected to RNAseq (B) Venn diagram showing differentially expressed genes in KMT5B-expressing clones KMT5B#3 and KMT5B#7. Both comparisons were made independently against the expression profile of the LN-229 control cells (mock). (C) Network diagram showing the functional relationships between the genes differentially expressed in the RNAseq analysis and disease ontologies (glioblastoma and renal diseases) obtained from DisGeNET. To facilitate the interpretation of the data, the relationships of genes and ontologies common to both conditions are indicated. Information on the expression levels of the different genes compared to the control (mock) is indicated by the colour scale. (D) Enrichment of H4K20me2 upstream of the IL13RA2 and CDH11 transcription start sites due to KMT5B overxpression. Chromatin immunoprecipitation (ChIP) assays were performed in mock and KMT5B stably-transfected LN-229 cells using either anti-H4K20me2 polyclonal antibody or control IgG (see Supplementary Table 2). DNA eluted from the ChIP assay was amplified by qRT-PCR with primer sets mapping to IL13RA2 or CDH11 promoters (listed in Supplementary Table 1). The enrichment of H4K20me2 at the indicated regions in KMT5B clones was compared to the same regions in mock control cells (Welch t-tests; *p < 0.05; **p < 0.01; ***p < 0.001).

