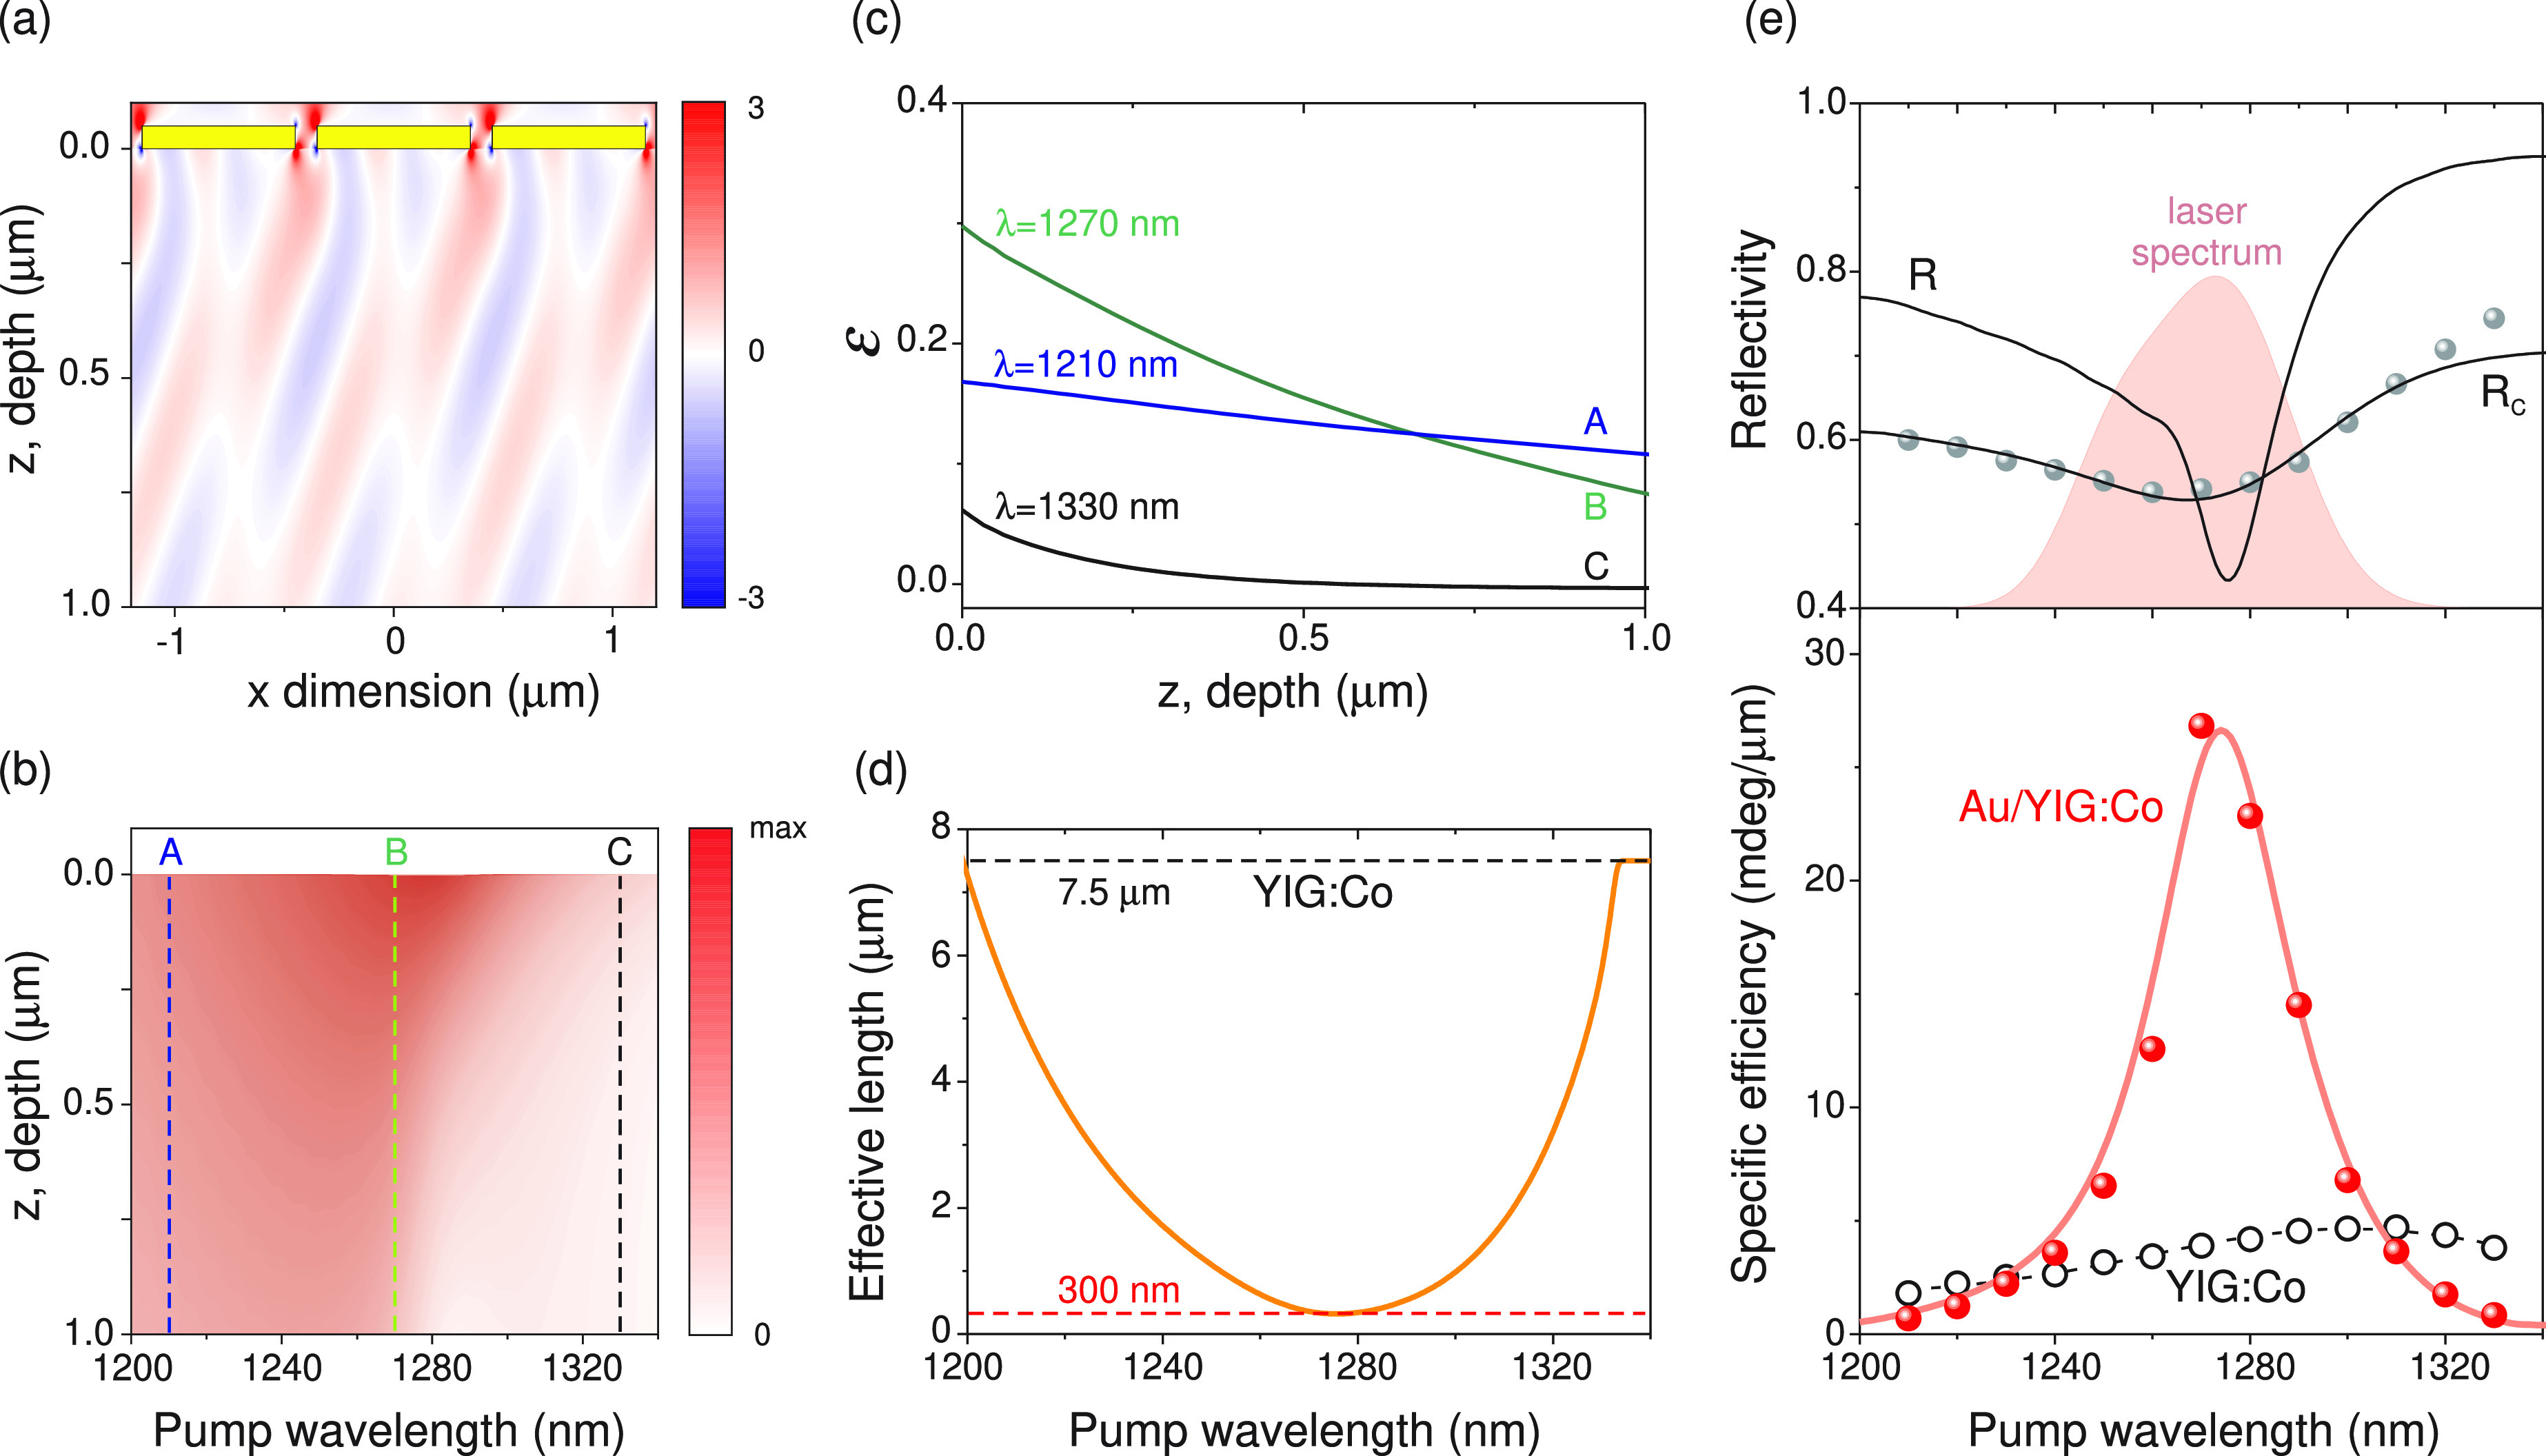
Figure 3.

(a) Numerically
simulated spatial distribution  (x,z)
inside the YIG:Co layer at the SPP resonance (λ = 1270 nm).
The yellow bars indicate the Au grating. (b, c) Depth profiles
  (z,λ) integrated
across the x-dimension. The dashed lines indicate
three λ values that are shown in (c) in detail; B (λ = 1270 nm) corresponds to the resonant SPP excitation.
(d) Calculated effective decay depth leff of the photomagnetic excitation away from the Au/YIG:Co interface.
The top dashed line at 7.5 μm indicates the total thickness
of the YIG:Co layer. The bottom dashed line at 300 nm shows the shortest
effective depth obtained at the resonance. (e) (top) Calculated reflectivity
spectra, before (R) and after (Rc) taking into account the spectral broadening due to
the finite laser pulse duration. Full dots: experimental Au/YIG:Co
reflectivity. The shaded area illustrates the measured laser spectrum
at around λ = 1270 nm. (bottom) Specific efficiency of the photomagnetic
excitation for the bare garnet (open dots) and Au:YIG/Co (full dots).
The solid red line is the result of the numerical simulations.
