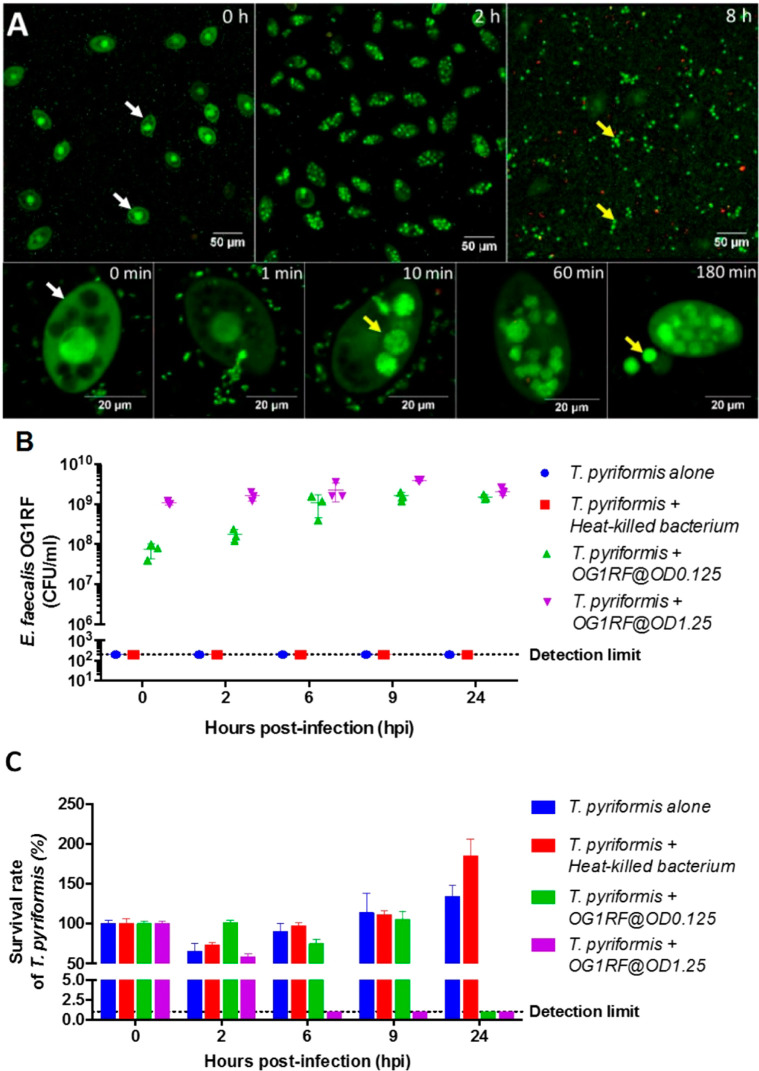
Figure 2.
E. faecalis and T. pyriformis coculture model. (A) The infection cycle of the host T. pyriformis by E. faecalis. The E. faecalis-T. pyriformis coculture was sampled over time and labeled using bacterial Live/Dead stain (i.e., syto9/propidium iodide) prior to CLSM imaging. (B) The E. faecalis cell count (CFU/mL) enumerated on TSB agar, and (C) the T. pyriformis survival rate during the course of infection (Mean ± SD, n = 6).

