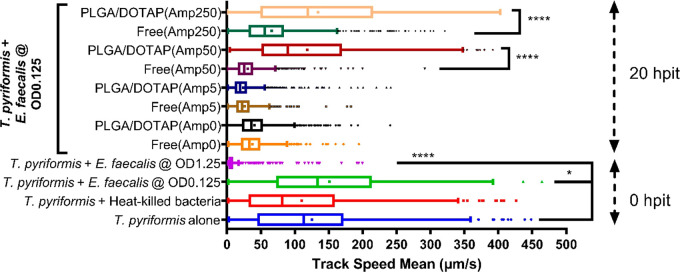
Figure 4.
Motility of T. pyriformis determined as the track speed mean was assessed 0 and 20 h postinfection treatment. Bar in the middle represents the median, and dot represents the mean. For the downmost 4 groups, nonparametric Kruskal–Wallis test was performed in comparison with the group of “T. pyriformis alone”, respectively. For the other 8 groups at 20 hpit, nonparametric Kruskal–Wallis test with multiple comparisons was performed to investigate the effect of LPN encapsulation. The statistical differences are indicated as follows: * P < 0.05, **** P < 0.0001.

