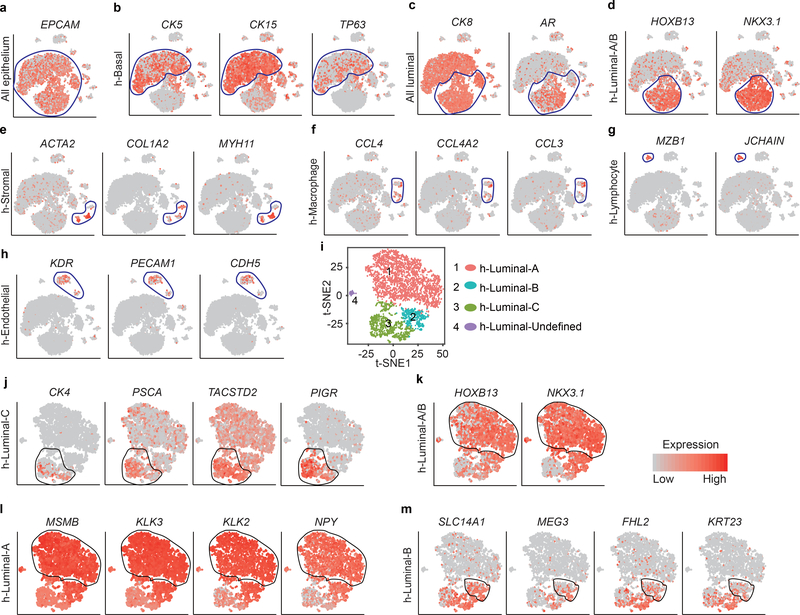
Extended Data Fig. 9 |. Decoding of the identity of cell types within the main human prostate cell clusters.
a, T-SNE maps show the expression levels of epithelial cell marker Epcam across 7 clusters. Blue circles indicate all the epithelial cell clusters (n = 9,825 cells). b-h, T-SNE maps show the expression levels of marker genes across 7 clusters. Blue circles indicate the h-Basal cluster (n = 5,696 cells)(b), all luminal cell clusters (n = 4,129 cells)(c), h-Luminal-A/B cluster (n = 3,434 cells) (d), h-Stromal cluster (n = 387 cells) (e), h-Macrophage cluster (n = 439 cells) (f), h-Lymphocyte cluster (n = 106 cells) (g), and h-Endothelial cluster (n = 617 cells) (h). i, Visualization of clustering of prostate single luminal cells, based on the expression of known marker genes by t-SNE (n = 4,129 cells). Decoding of the identity of cell types within the main luminal cell clusters. j, T-SNE maps show the expression levels of h-Luminal-C cell markers CK4, PSCA, TACSTD2 and PIGR (n = 908 cells). k, T-SNE maps show the expression levels of mouse Luminal-A/B cell markers HOXB13 and NKX3.1 (n = 3,166 cells). l, T-SNE maps show the expression levels of h-Luminal-A cell markers MSMB, KLK3, KLK2 and NPY (n = 2,743 cells). m, T-SNE maps show the expression levels of Luminal-B cell markers SLC14A1, MEG3, FHL2 and KRT23 (n = 423 cells). Black circle indicate the indicated cell clusters. t-SNE maps showed cells that are colored by the log-scale normalized read count of marker genes.

