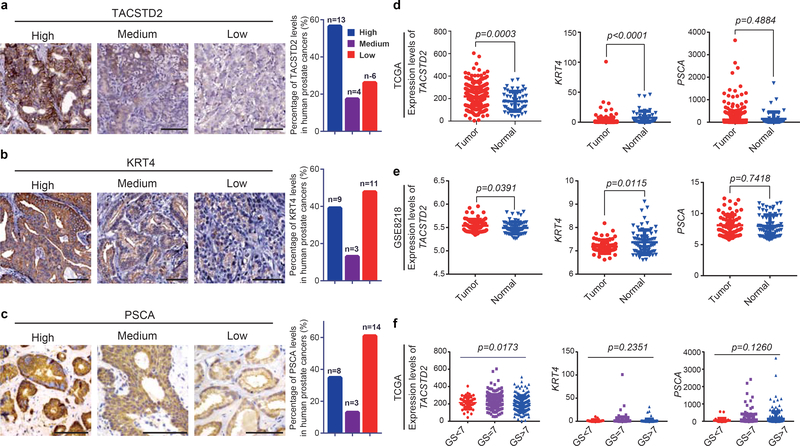
Extended Data Fig. 10 |. The expression levels of h-Luminal-C markers in human prostate cancer.
a, TACSTD2 immunohistochemistry staining of human prostate cancer samples (left panel), the graph indicates the percentage of TACSTD2 expression level (low, medium, high) in human prostate cancer samples (right panel). b, KRT4 immunohistochemistry staining of human prostate cancer samples (left panel), the graph indicates percentage of KRT4 expression level (low, medium, high) in human prostate cancer samples (right panel). c, PSCA immunohistochemistry staining of human prostate cancer samples (left panel), the graph indicates percentage of PSCA expression level (low, medium, high) in human prostate cancer samples (left panel). d,e, The expression levels of h-Luminal-C markers (TACSTD2, KRT4, PSCA) were analyzed in human prostate tumors and normal prostates from TCGA (n=547) (d) and GSE8218 (n=136) (e) data set. f, Graphs indicate the relationship between expression levels of h-Luminal-C markers (TACSTD2, KRT4 and PSCA) and tumor stage (n=547). Scale bars, 50μm (a-c). 13 prostate cancer samples are from Fudan University Shanghai Cancer Center, the others are from the Human Protein Atlas (https://www.proteinatlas.org/) (a-c). These experiments were administered three times with similar results (a-c). Data show mean ± standard deviation and unpaired two-tailed Student’s t-test (d-f).

