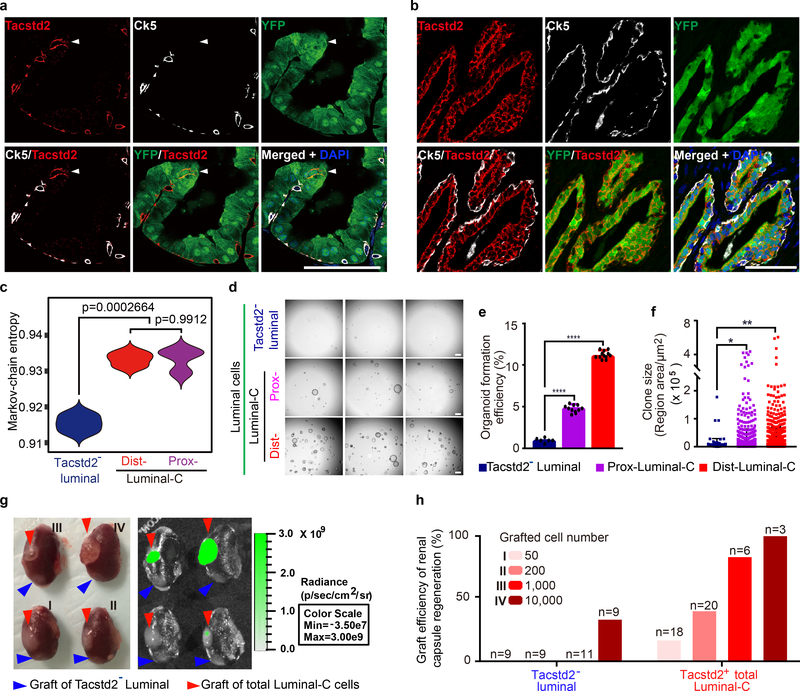
Figure 2 |. Localization and characterization of Luminal-C cells.
a,b, Immunofluorescence staining for YFP and Tacstd2 shows that Luminal-C cells are in the distal prostate invagination tip (arrow) (a) and proximal prostate region (b) of T2Y mice. c, Violin plot comparing the Markov-chain entropy (MCE) of Tacstd2-negative luminal cells (n = 3 samples), Dist-Luminal-C cells (n = 3 samples) and Prox-Luminal-C cells (n = 3 samples). The P value is from the one-sided t test. d, Micrographs of organoids formed by Tacstd2-negative luminal cells, Prox-Luminal-C cells and Dist-Luminal-C cells isolated from the T2Y mouse prostate and cultured in Matrigel with mouse prostate organoid medium (scale bars, 500 μm). e,f, Organoid formation efficiency (n = 6, n = 11, n = 12) (e) and organoid size (n = 109, n = 891, n = 1,029) (f) of Tacstd2-negative luminal cells, Pro-Luminal-C cells and Dis-Luminal-C cells calculated after one week of culture. The data are presented as the mean ± standard deviation of five replicates, and 3 mice were used for each experiment. g, Photographs of renal capsule regeneration with 50 cells (I), 200 cells (II), 1,000 cells (III) and 10,000 cells (IV) at 2.5 months after transplantation. The red arrowheads show Luminal-C cell grafts, and the blue arrowheads show Tacstd2− luminal cell grafts. Bioluminescence intensity is shown in photons per second per centimeter squared per steradian (p s−1 cm−2 sr−1) h, Box plot of the graft efficiency of Tacstd2-negative luminal cells and total Luminal-C cells. Six mice were used for each experiment, and each experiment was performed three times. Scale bars, 50 μm (a,b). Data were analyzed by unpaired two-tailed Student’s t test, * P < 0.05, ** P < 0.01, *** P < 0.001 and **** P < 0.0001 (e,f).

