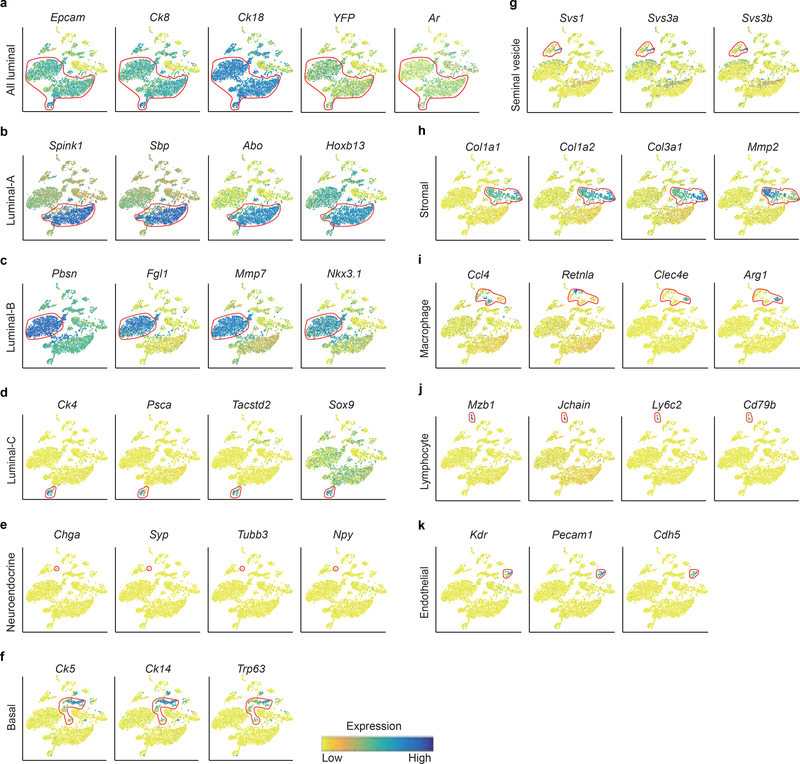
Extended Data Fig. 1 |. Decoding of the identity of cell types within the main clusters.
(n = 8,545 cells). a, T-SNE maps show the expression levels of epithelial cell marker Epcam and known luminal cell marker genes (Ck8, Ck18, Ar, EYFP) across 11 clusters. Red circles indicate all the luminal cell clusters. b-k, T-SNE maps show the expression levels of marker genes across 11 clusters. Red circles indicate the Luminal-A cluster (n = 2,773 cells) (b), Luminal-B cluster (n = 2,233 cells) (c), Luminal-C cluster (n = 232 cells) (d), Neuroendocrine cell cluster (n = 4 cells) (e), Basal cluster (n = 747 cells) (f), Seminal Vesicle cluster ( n = 406 cells) (g), Stromal cluster (n = 1,208 cells) (h), Macrophage cluster (n = 660 cells) (i), Lymphocyte cluster (n = 114 cells) (j), Endothelial cluster (n = 168 cells) (k). t-SNE map shows cells that are colored by the log-scale normalized read count of marker genes.

