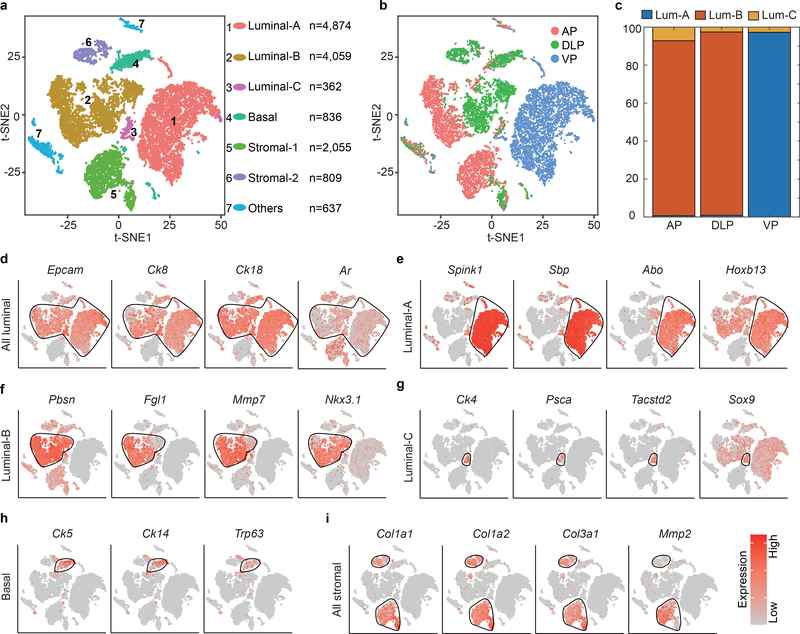
Extended Data Fig. 2 |. Lobe specific distribution of luminal clusters.
a, Visualization of clustering of 13,632 single cells from freshly dissociated AP, VP and DLP of WT mice at age of 10 weeks, based on the expression of known marker genes by t-SNE. b, Visualization the lobe distribution patterns of different cell clusters (n = 13,632 cells). c, Bar graph shows the percentage of the three luminal cell lineages in AP, VP and DLP. d-i, T-SNE maps show the expression levels of marker genes across 7 clusters. Black circle indicate the Luminal clusters (n = 9,295 cells) (d), Luminal-A cluster (n = 4,874 cells) (e), Luminal-B cluster (n = 4,059 cells) (f), Luminal-C cluster (n = 362 cells) (g), Basal cluster (n = 836 cells) (h), Stromal cluster (n = 2,864 cells) (i). T-SNE map shows cells that are colored by the log-scale normalized read count of marker genes.

