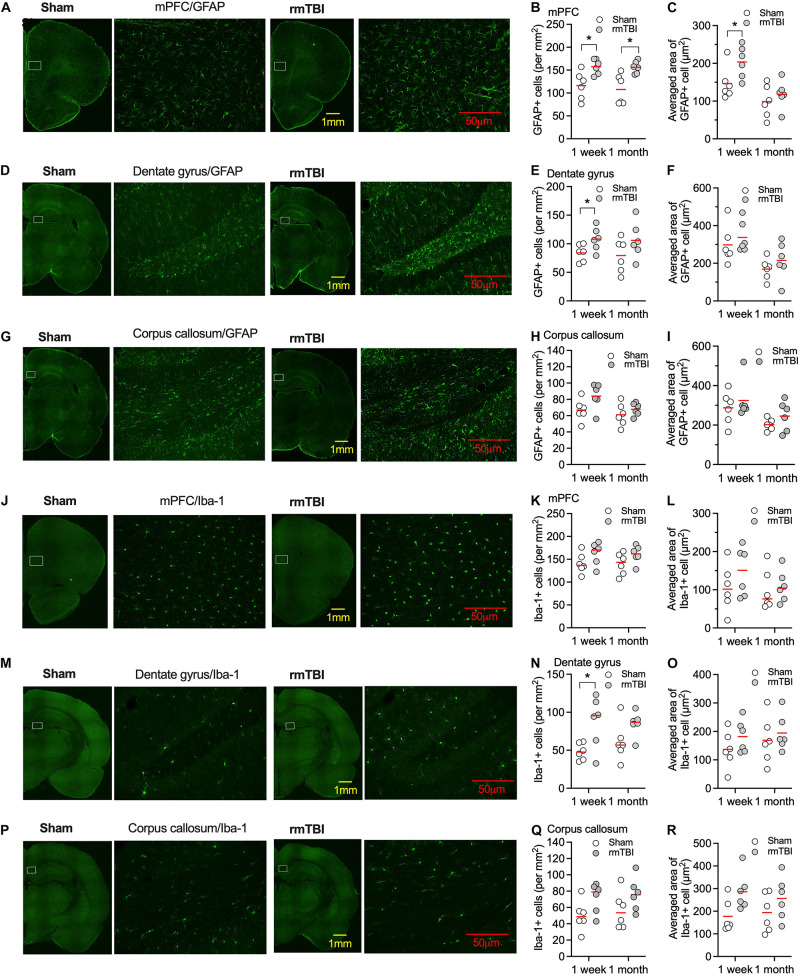
FIGURE 5.
Expression of GFAP and Iba-1 after rmTBI. In mPFC, there are increased number of GFAP+ cells 1 week and 1 month after rmTBI in mPFC (A,B). (C) There are increased averaged area of GFAP+ cells 1 week after rmTBI in mPFC. There are increased number of GFAP+ cells 1 week after rmTBI in dentate gyrus (D,E), but not in averaged area of GFAP+ cells (F). (G–I) No differences in number of GFAP+ cells and averaged area of GFAP+ cells are found from injury in corpus callosum. (J–L) No differences of number of Iba-1+ cells and averaged area of Iba-1+ cells are found from injury in mPFC. (M–O) There are increased number of Iba-1+ cells 1 week after rmTBI in dentate gyrus and no differences of averaged area of Iba-1+ cells are found from injury in dentate gyrus. (P–R) No differences in number of Iba-1+ cells and averaged area of Iba-1+ cells are found from injury in corpus callosum. White rectangles in images with low power objective magnification represent areas for the images with high power objective magnification on their right side. Each dot represents averaged expression from 3 brain slice sections from each rat. Red bars represent mean. *P < 0.05 by planned comparison with Bonferroni correction.

