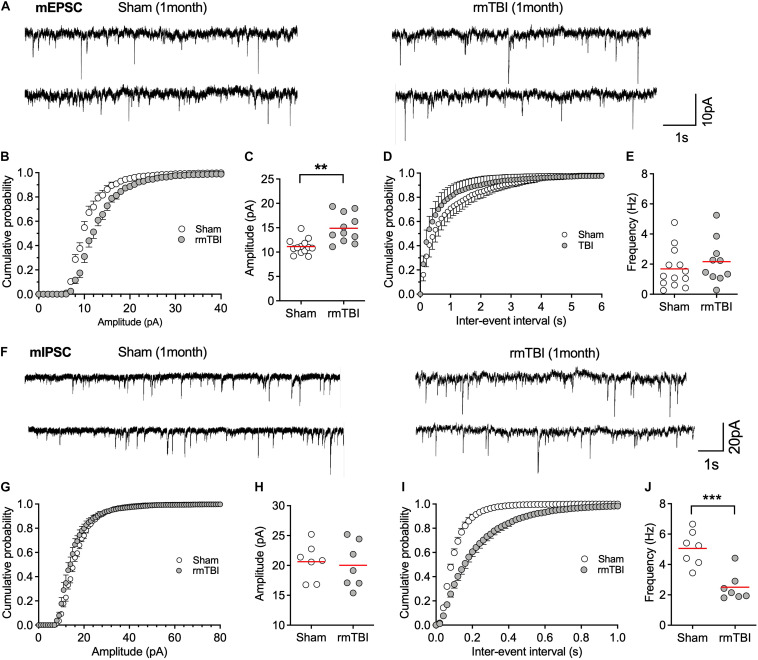
FIGURE 9.
rmTBI on synaptic transmission in mPFC. (A) Representative traces of mEPSC from rats 1 month after rmTBI and time-matched control rats with sham injury. (B) Cumulative probability and (C) average amplitude of mEPSC. (D) Cumulative probability and (E) average frequency of mEPSC. (F) Representative traces of mIPSC from rats 1 month after mTBI and time-matched control rats with sham injury. (G) Cumulative probability and (H) average amplitude of mIPSC. (I) Cumulative probability and (J) average frequency of mIPSC. Each dot represents data from one neuron. Recordings were from 6 rats with sham TBI and 6 rats rmTBI. **P < 0.01, ***P < 0.001 by t-test.

