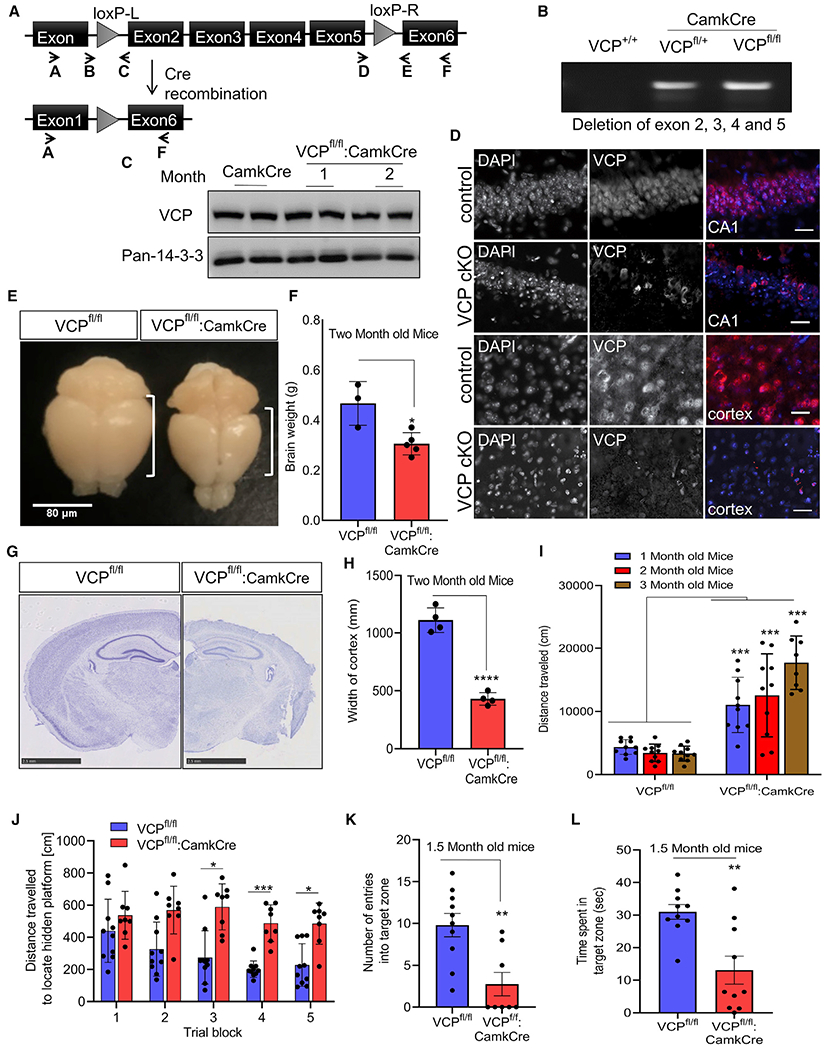
Figure 1. Loss of VCP in forebrain neurons causes cortical brain atrophy.

(A) VCP inactivation strategy.
(B) Agarose gel of cortical brain genomic DNA PCR amplification using primers A and F from (A), confirming LoxP recombination in VCPFL/WT or VCPFL/FL crossed to CaMKIIα-Cre mice (VCP cKO).
(C) Immunoblot for VCP and 14-3-3 (loading control) of cortical brain lysates from control (CamkCre) or VCP cKO mice at 1 and 2 months.
(D) VCP (red) immunofluorescence and DAPI nuclear (blue) fluorescence of coronal sections through the CA1 region of the hippocampus or cortex of 1-month-old VCP cKO mice and 2-month-old control mice (representative images of four control and six VCP cKO mice). Scale bars, 25 μm.
(E) Gross brain image of 2-month-old control (VCPFL/FL) or VCP cKO mice. Scale bar, 80 μm.
(F) Bar graph of brain weights from 2-month-old control or VCP cKO mice. Data represent mean ± SD (error bars) (n = 3 and 5 animals, respectively). *p < 0.05 by unpaired t test.
(G) Micrograph of 2-month-old control or VCP cKO coronal mouse brain sections stained with cresyl violet. Scale bars, 2.5 mm.
(H) Bar graph of cortical width from 2-month-old control of VCP cKO mice. ****p < 0.0001 by unpaired t test. Data represent mean ± SD (error bars) (n = 3 slices from four mice per group).
(I) Locomotor activity levels of VCP cKO mice (RM ANOVA interaction between genotype and age, F(1,52) = 103.6, p < 0.0001; ***p < 0.001 for each comparison within age). Data represent mean ± SEM (error bars) (n = 10 mice/group).
(J) Distance traveled to locate hidden platform (RM ANOVA) (F(4,80) = 3.187.6, p = 0.0176). Main effect of genotype p < 0.0001, with post hoc comparisons showing a shorter distance between genotypes by trial blocks 3 (*p < 0.05), 4 (***p < 0.001), and 5 (*p < 0.05). Data represent mean ± SEM (error bars) (n = 10 mice/group).
(K) Entries into the target zone during the probe trial compared to controls (**p < 0.01 by t test).
(L) Time searching the quadrant where platform is hidden (**p < 0.01 by t test). Data represent mean ± SEM (error bars) (n = 10 mice/group).
