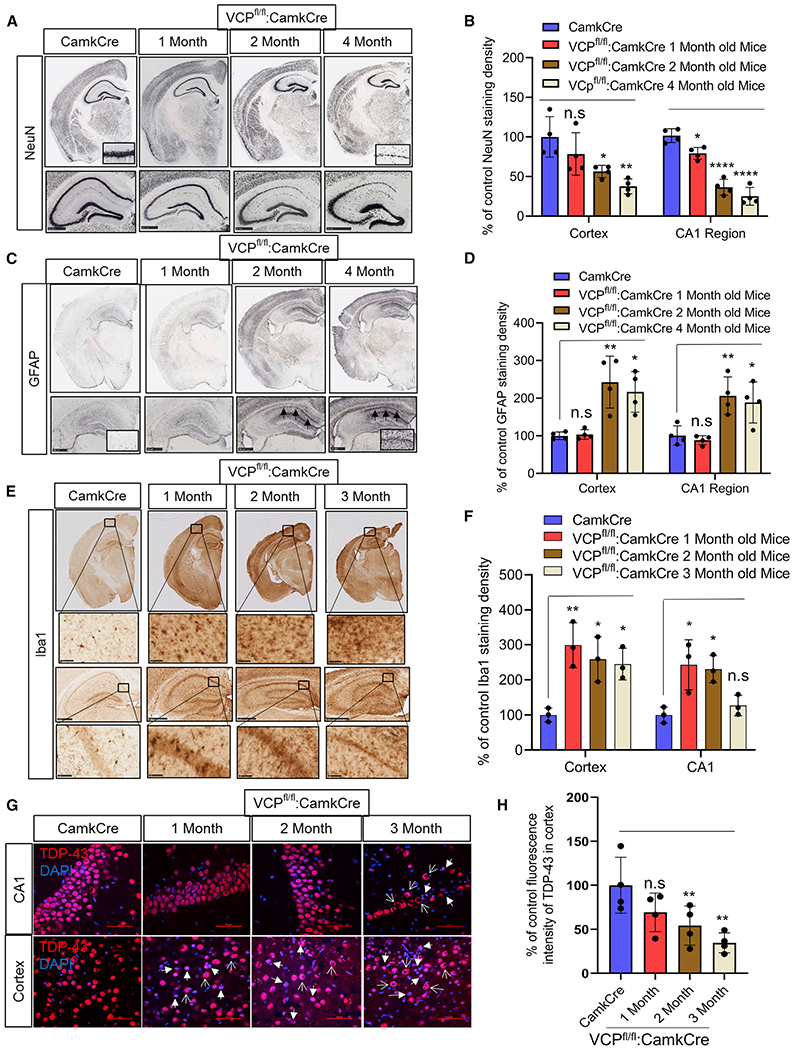
Figure 2. Loss of VCP in forebrain neurons causes neurodegeneration and TDP-43 pathology.

(A) NeuN staining of coronal sections through the cortex and hippocampus of control (CamKcre) or 1-, 2-, and 4-month-old VCP cKO mice. Insets denote CA1 region of the hippocampus. Scale bars, 500 μm.
(B) Quantitation of NeuN. Data represent mean ± SD (error bars) (data points represent mice) (n = 4 slices from four mice per group). A one-way ANOVA was used for statistical testing, treating four slices from four mice as an independent sample; cortex is F(3,12) = 57.34, p = 0.0001 and CA1 region is F(3,12) = 7.689, p = 0.0040. Post hoc comparisons using Tukey’s test, *p < 0.02.
(C) GFAP staining of coronal sections through the cortex and hippocampus of control (Camkcre) or 1-, 2-, and 4-month-old VCP cKO mice. Insets and arrows denote CA1 region of the hippocampus. Scale bars, 500 μm.
(D) Quantitation of GFAP staining. Data represent mean ± SD (error bars) (data points represent mice). A one-way ANOVA was used for statistical testing, treating four slices from four mice as an independent sample; cortex is F(3,12) = 11, p = 0.0009 and CA1 region is F(3,12) = 9, p = 0.0019. Post hoc comparisons using a Tukey’s test, *p < 0.02.
(E) Iba1 staining of coronal sections through the cortex and hippocampus of control (Camkcre) or 1-, 2-, and 4-month-old VCP cKO mice. Scale bars, 2.5 mm. Insets denote CA1 region of the hippocampus. Scale bars, 500 μm.
(F) Quantitation of Iba1 staining. Data represent mean ± SD (error bars) (n = 2 slices from four mice per group). The quantification was done by ImageJ software. Data represent mean ± SD (error bars) (data points represent mice). A one-way ANOVA was used for statistical testing treating two slices from three mice as an independent sample; cortex is F(3,8) = 8.4, p = 0.0073 and CA1 region is F(3,8) = 7.8, p = 0.0091. Post hoc comparisons using Tukey’s test, *p < 0.02.
(G) TDP-43 (red) immunofluorescence and DAPI nuclear (blue) fluorescence of the cortex and CA1 region of the hippocampus from control (CamkCre) and 1-, 2-, and 3-month old VCP cKO mice. Closed arrows indicate the loss of TDP-43 from the nucleus, and open arrows indicate cytosolic TDP-43. Scale bars, 50 μm.
(H) Quantitation of TDP-43 fluorescence intensity. Data represent mean ± SD (error bars) (data points represent mice). A one-way ANOVA was used for statistical testing, treating three slices from four mice as an independent sample; F(3,12) = 5, p = 0.0111. Post hoc comparisons using Tukey’s test, *p < 0.02.
