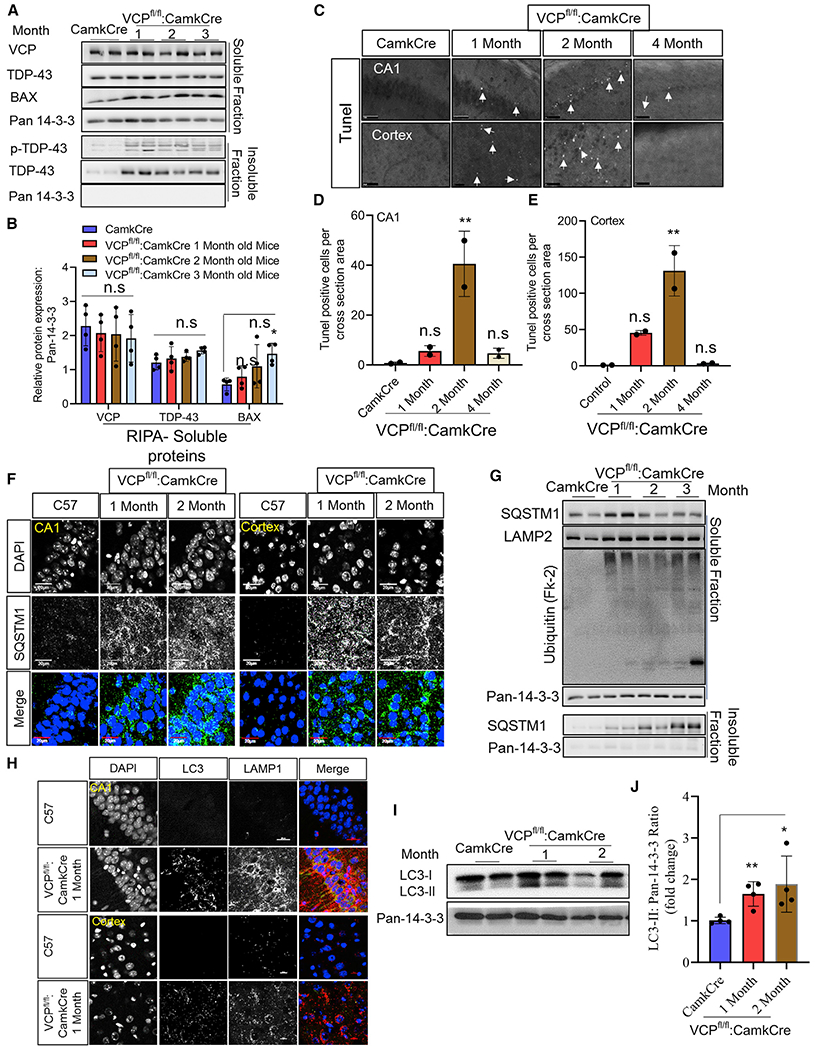
Figure 3. Loss of VCP in forebrain neurons leads to neuronal death and autophago-lysosomal dysfunction.

(A) Soluble and insoluble proteins from brain lysates of control and 1-, 2-, and 3-month-old VCP cKO mice immunoblotted with antibodies to VCP, TDP-43, pTDP-43, BAX, and 14-3-3 (as a loading control).
(B) Quantitation of band intensities of VCP, TDP-43, and BAX relative to 14-3-3 (n = 4 animals per group). The quantification was done by ImageJ software. Data represent mean ± SD (error bars) (data points represent mice). A one-way ANOVA was used for statistical testing treating each brain as an independent sample; VCP is F(3,12) = 0, p = 0.8863, TDP-43 is F(3,12) = 1, p = 0.2082, and BAX is F(3,12) = 3, p = 0.0408. Post hoc comparisons using a Bonferroni test, *p < 0.02.
(C) TUNEL staining of the cortex and CA1 region of the hippocampus from control (CamkCre) and 1-, 2-, and 4-month-old VCP cKO mice. Closed arrows mark TUNEL-positive nuclei. Scale bars, 500 μm.
(D and E) Quantitation of TUNEL-positive cells. Data represent mean ± SD (error bars) (n = 2 slices from two animals per group). Data represent mean ± SD (error bars) (data points represent mice). A one-way ANOVA was used for statistical testing, treating two slices from two mice as an independent sample; cortex is F(3,4) = 24, p = 0.0050 and for the CA1 region is F(3, 4) = 15, p = 0.0118. Post hoc comparisons using Tukey’s test, **p < 0.01.
(F) SQSTM1 (green) immunofluorescence and DAPI nuclear (blue) fluorescence of the cortex and CA1 region of the hippocampus from control (C57) and 1- or 2-month-old VCP cKO mice. Scale bars, 20 μm (n = 3 slices from four mice per group).
(G) Soluble and insoluble proteins from brain lysates of control (CamkCre) and 1-, 2-, and 3-month-old VCP cKO mice immunoblotted with antibodies to SQSTM1, Lamp2, ubiquitin-conjugates (FK2), and 14-3-3 (as a loading control) (n = 4 animals per group).
(H) LC3 (green), Lamp1 (red) immunofluorescence, and DAPI nuclear (blue) fluorescence of the cortex and CA1 region of the hippocampus from control (C57) and 1-month-old VCP cKO mice. Scale bars, 20 μm (n = 3 slices from four mice per group).
(I) Immunoblot for LC3 and 14-3-3 (loading control) of brain lysates from control (CamkCre) or 1-month-old VCP cKO mice.
(J) Quantitation of the ratio of the band intensities of LC3II:14-3-3. Data represent mean ± SD (error bars) (n = 4 animals per group). Unpaired t test, **p < 0.01; n.s., not significant.
