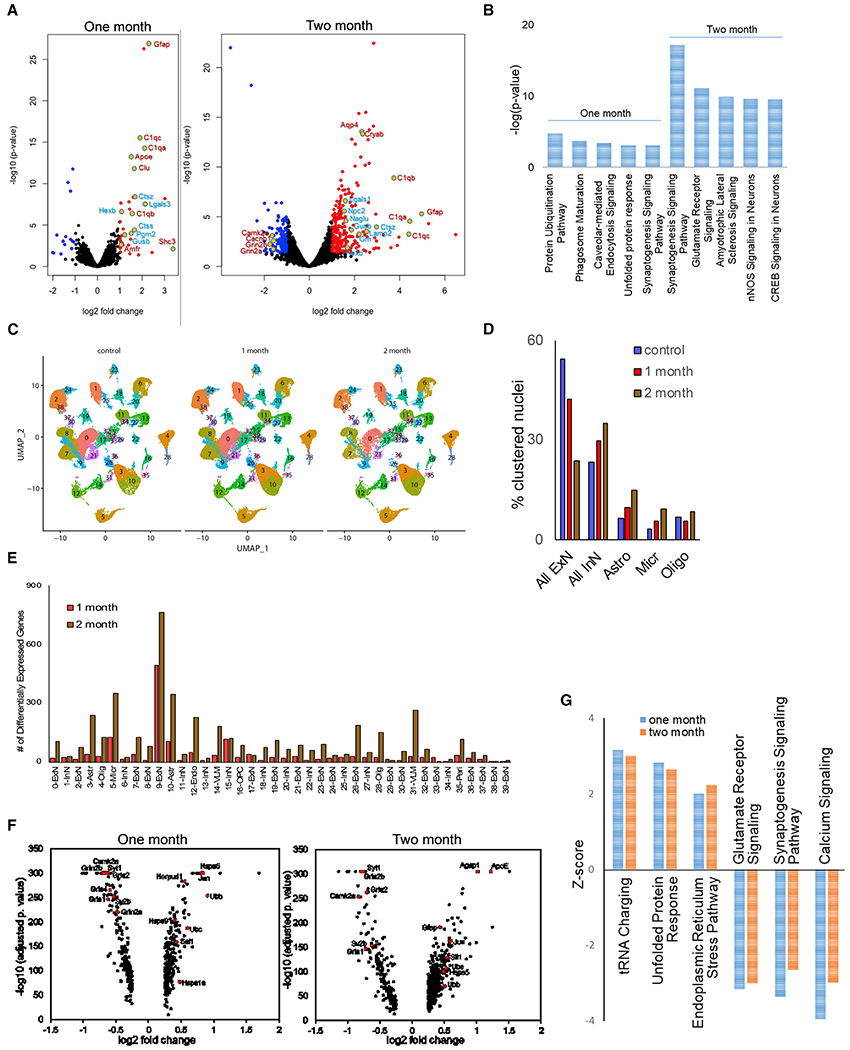
Figure 4. Proteomic and transcriptomic signatures of VCP inactivation in the brain.

(A) Volcano plots of differentially abundant proteins (DAPs) in 1- and 2-month-old VCP cKO cortices as compared with age-matched controls.
(B) Graph of the most significantly enriched pathways following Ingenuity Pathway Analysis (IPA) of DAPs at 1 and 2 months.
(C) UMAP of nuclear clusters from control and 1- or 2-month-old VCP cKO cortices.
(D) Graph of the percentage of nuclei clustered within the categories of excitatory neuron (ExN), inhibitory neuron (InN), astrocytes (Astro), microglia (Micro), and oligodendrocytes (Oligo) in control and 1- or 2-month-old VCP cKO cortices.
(E) Graph of the number of differentially expressed genes (DEGs) in each nuclear cluster from 1- and 2-month-old VCP cKO cortices. VLM, vascular leptomeningeal cell; Peri, pericyte; OPC, oligodendroglia precursor cell; Endo, endothelial cell.
(F) Volcano plots of DEGs from cluster 9 in 1- and 2-month-old VCP cKO cortices as compared with age-matched controls.
(G) Graph of the three most increased and decreased pathways according to Z score following IPA of DEGs at 1 and 2 months.
