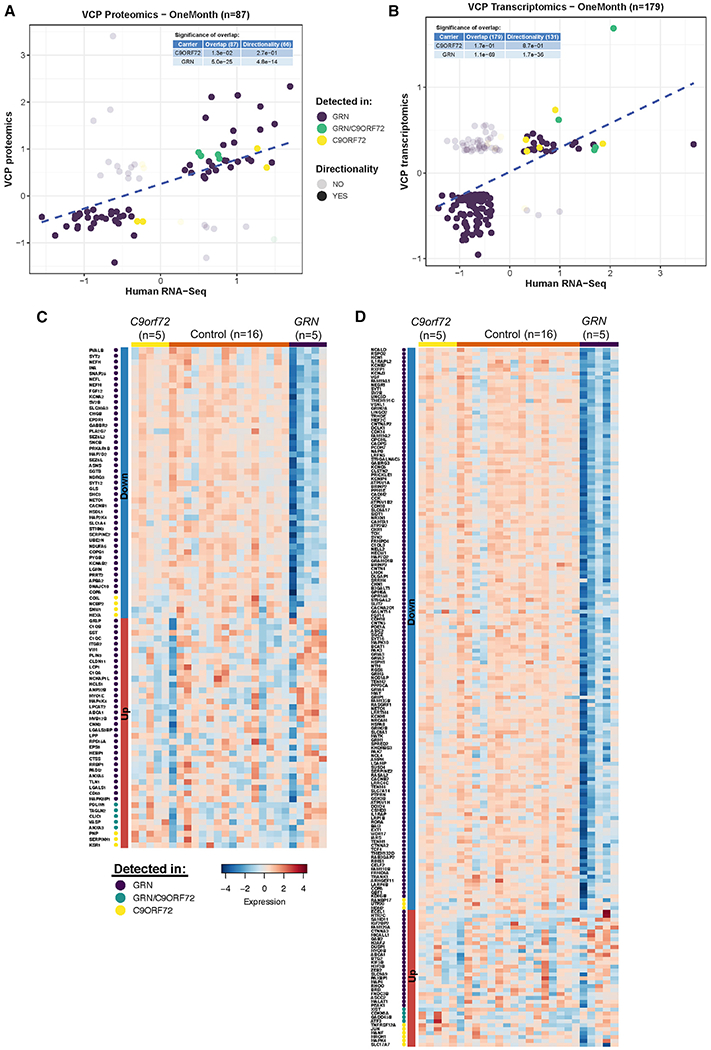
Figure 7. The proteomic and transcriptomic signatures of VCP deficiency are present in GRN carriers.

(A and B) The effect sizes of significantly different DEPs (A) and DEGs found in neurons from cluster 9 (B) from 1-month-old VCP cKO mice are compared to those effects from transcriptomic profiles of human parietal cortices with FTLD-TDP. The effects of significant differential gene expression products by comparing five GRN carriers (purple) versus neuropathology-free controls are shown (75 DEPs and 166 neuronal DEGs, respectively). Similarly, the effect of the comparison between the five carriers of the repeat expansion in C9orf72 (yellow) versus neuropathology-free controls is shown (seven DEPs and nine neuronal DEGs, respectively). The five DEPs and four neuronal DEGs identified for both genetic strata are shown in green. The tables embedded in each plot report the p value (hypergeometric test) product of comparing the extent of overlap (all) and directionality (same direction of effect) between genes detected in VCP cKO mice and human brains.
(C) A heatmap representing the gene expression (TPM) for significantly upregulated/downregulated genes overlapping between VCP cKO DEPs and FTLD-TDP GRN and C9orf72 carriers indicated in (A). The genes are ordered by their genetic strata and log fold change (FC).
(D) Same as (C), but showing the genes overlapping between VCP cKO neuronal DEGs and brain transcriptomics from FTLD-TDP GRN and C9orf72 reported in (B).
