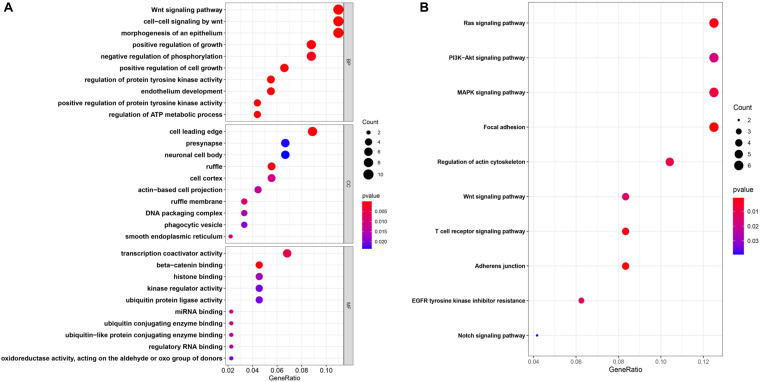
FIGURE 4.
(A,B) Enrichment of the top 10 Gene Ontology (GO) terms (A) and Kyoto Encyclopedia of Genes and Genomes (KEGG) pathways (B) of the differentially expressed mRNAs. The color of the dots changes gradually from blue to red in ascending order according to the adjusted P-values. The size of the node represents the number of counts.

