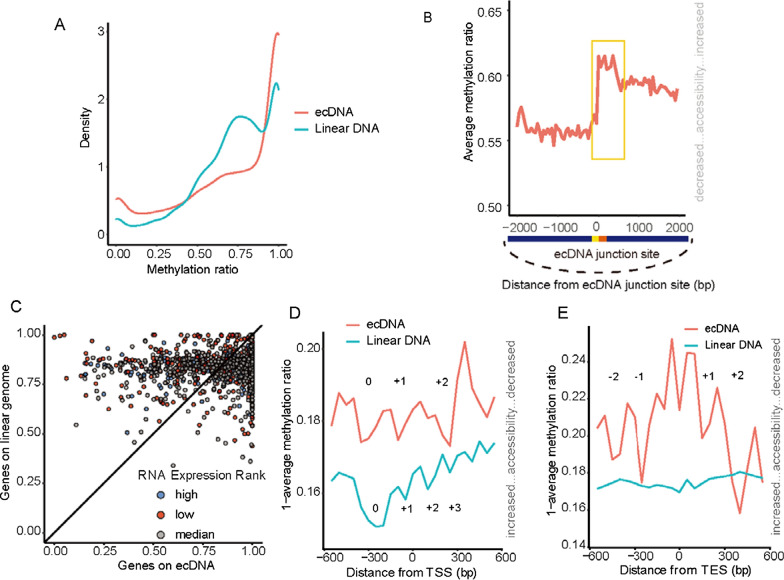
Fig. 2.
ecDNA and linear DNA have the different chromatin accessibility pattern. A Density distribution of the methylation ratio in ecDNA and linear DNA. B Average chromatin status around ecDNA neighboring regions is illustrated. The junction site and its right neighboring regions demonstrate the more open chromatin. C Average methylations of gene regions on ecDNA and linear DNA (from TSS to TES). The genes were classified into two groups: (I) the genes on linear DNA have more open chromatin structure than ecDNA carried genes (above centerline); (II) the ecDNA carried genes have more open chromatin structure than the genes on linear DNA (below centerline). D Average CCDA-seq profile around transcription start site on ecDNAs and linear DNA. E Average CCDA-seq profile around the transcription end site in the ecDNA and linear DNAs (aggregated over 50-bp windows sliding every 5 bp; the sequencing depth was normalized for ecDNA and linear DNA; see Method for details)

