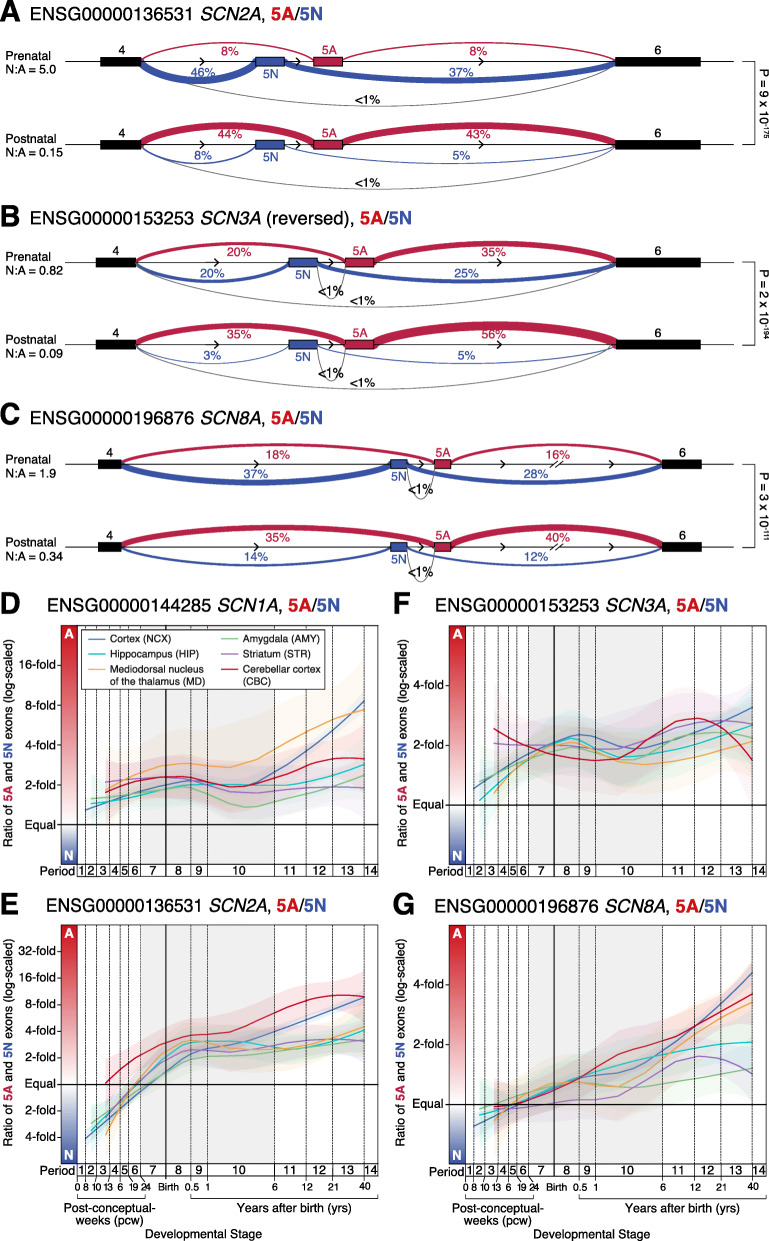
Fig. 3.
Orthogonal analysis of voltage-gated sodium channel gene splicing in the developing human brain. A Sashimi plot of splicing in prenatal (top, N = 112 samples) and postnatal (bottom, N = 60 samples) DLPFC for SCN2A. Linewidth reflects the proportion of split reads observed for each intron compared to all split reads between CDS 4 and CDS 6, this value is also shown as a percentage. Introns related to 5A inclusion are shown in red, those related to 5N inclusion are shown in blue, and others are in grey. B, C Equivalent plots for SCN3A (a negative-strand gene with the orientation reversed to facilitate comparison to the other two genes) and SCN8A. D The ratio of 5A and 5N expression is shown across development for SCN1A in six human brain regions. For each region, the colored line shows the Loess smoothed average and 95% confidence interval (shaded region). Equivalent data across 11 cortical regions are shown in Additional file 1: Fig. S6. E–G This analysis is repeated for SCN2A, SCN3A, and SCN8A. Statistical tests: A–C P values compare the prenatal and postnatal cluster using a Dirichlet-multinomial generalized linear model, as implemented in Leafcutter [41]

