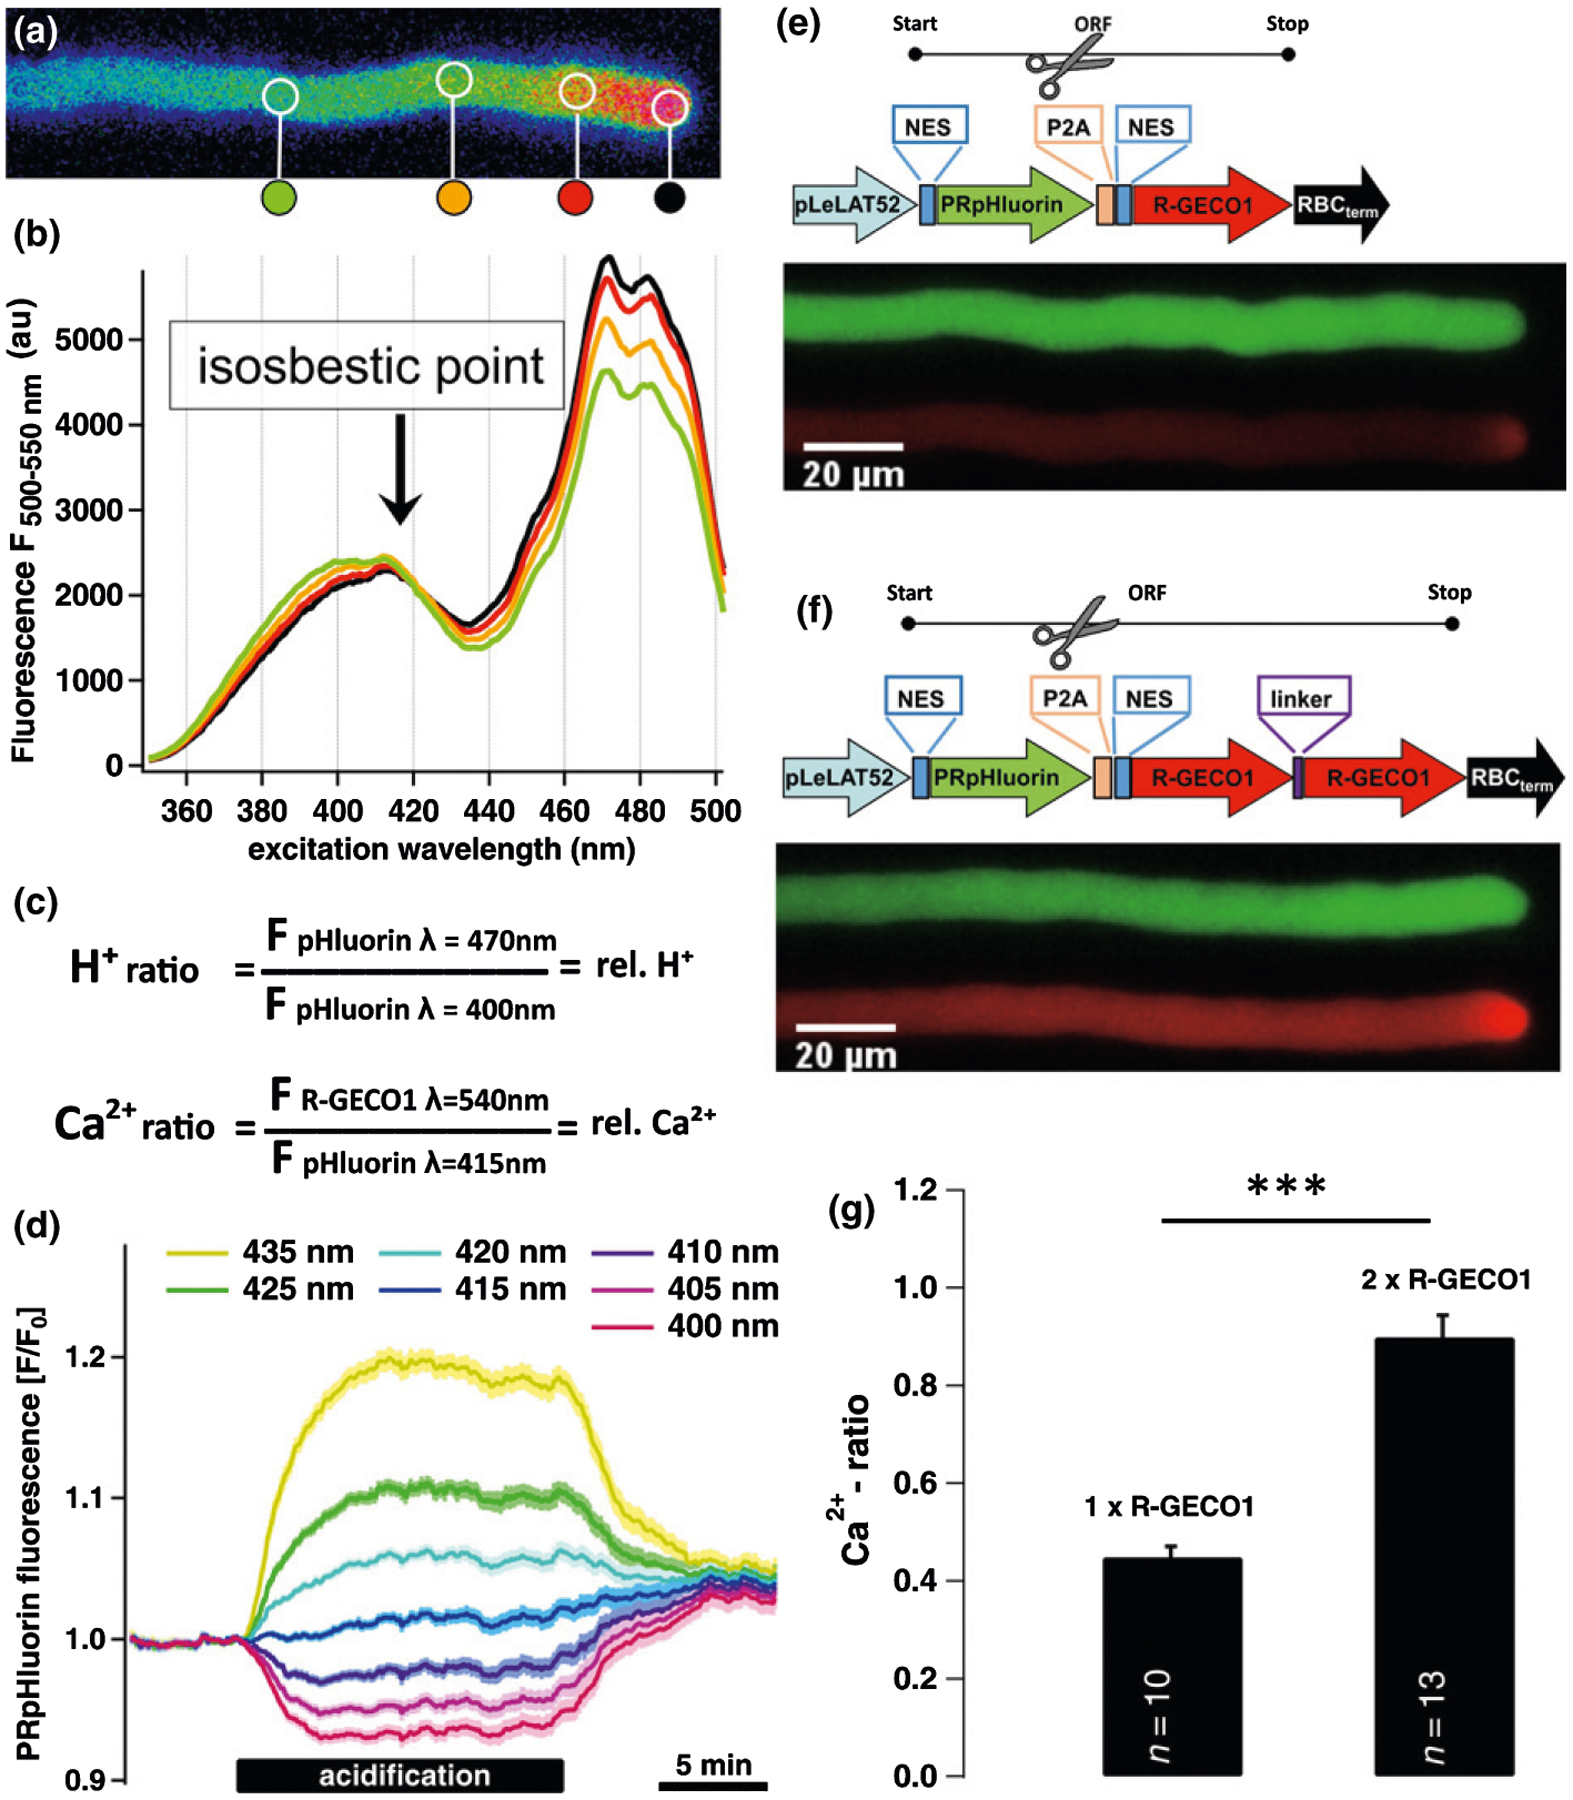
Fig. 1.

Design, verification and functioning of CapHensor. The structure of the multicistronic CapHensor vectors and expression in PTs to verify its function. (a) False colored [H+]cyt-ratio image of PRpHluorin transiently expressed in Nicotiana tabacum PTs. False color ranges from red, corresponding to slightly acidic lower pH (higher H+ concentration) in the tip, to gradually dissipating green-blue values in the shank indicating moderate alkalization. (b) The marked circular regions-of-interest in (a) reflect the areas of extracting the PRpHluorin excitation spectra which are displayed with the same color. The intersection point of the excitation spectra (415 nm) represents the isosbestic point (marked by arrow), the point where there is no variation of emission at 525 ± 12.5 nm in response to pH. (c) Formulas to generate [Ca2+]cyt and [H+]cyt ratios to represent relative Ca2+ and H+ concentrations, respectively. (d) Mean PRpHluorin fluorescence in mesophyll cells (n = 67) at the designated excitation wavelength after cellular acidification with 5 mM acetate (HAc). Despite progressive acidification, the fluorescence emission from the cytosol remains unchanged when excited with 415 nm. (e, f) Vector design and fluorescence intensity of PRpHluorin (green emission) and R-GECO1 (red emission) with the single or double R-GECO1 arrangement in stable transformed N. tabacum PTs. Spatial separation of the two fluorophores is achieved by the self-cleavage P2A sequence in the ORF indicated by the scissors. (g) Mean Ca2+-ratio values from shank regions of PT expressing vector constructs shown in (e) and (f). The doubling of the ratio reflects the increase in the R-GECO1 emission when ratioed with the same emission generated by the PRpHluorin. Error bars = SE. The t-test was used in (g). ***, P < 0.001.
