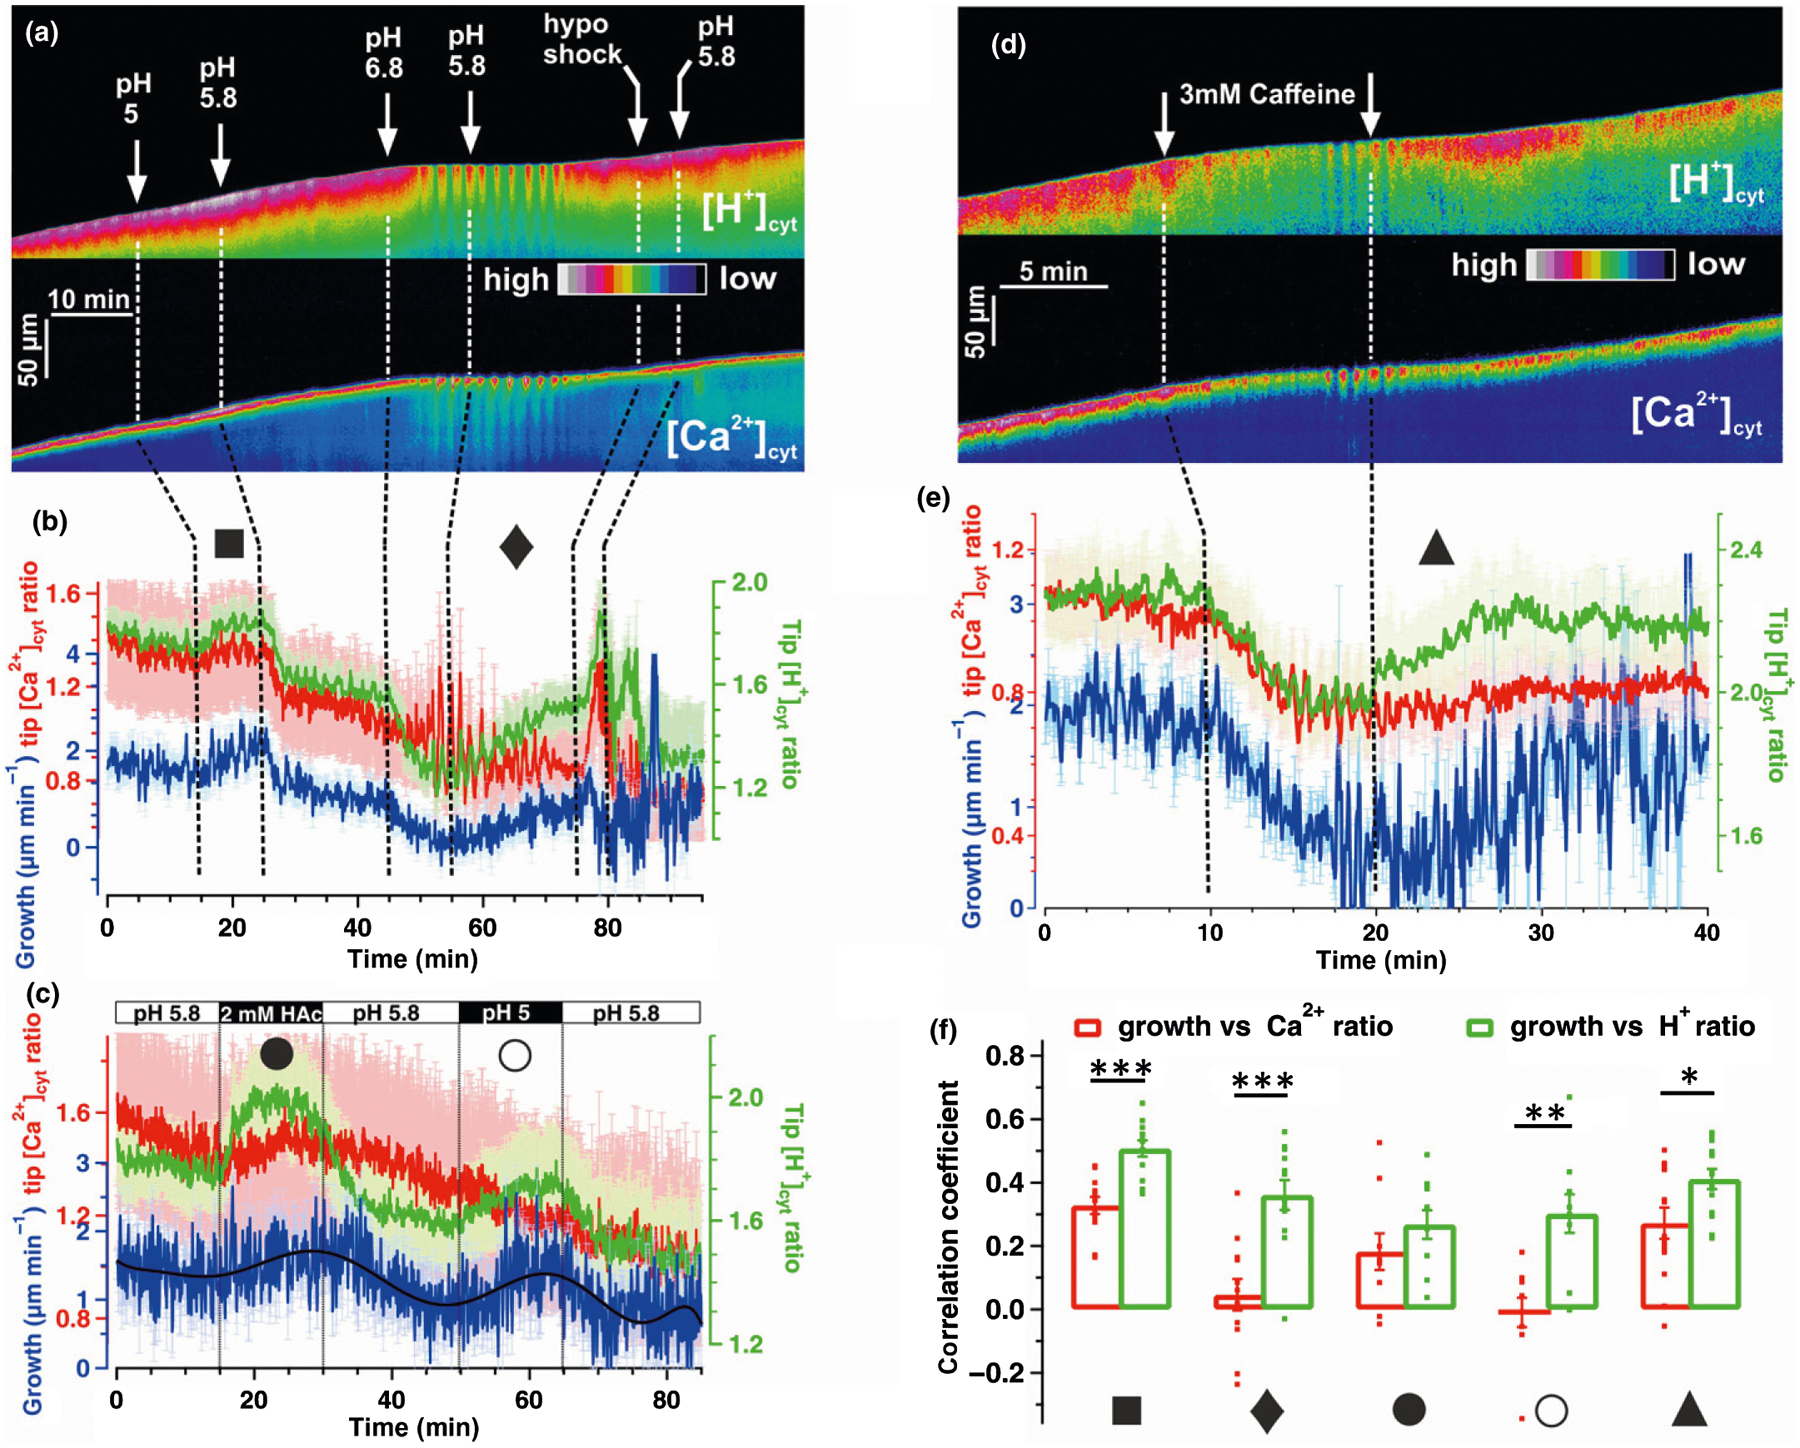
Fig. 2.

Interrelation of [Ca2+]cyt, [H+]cyt and growth in pollen tubes (PTs). Live-cell CapHensor imaging of Nicotiana tabacum PTs to quantify spatio-temporal interrelation of tip [Ca2+]cyt, [H+]cyt and growth under different conditions. (a) False colored [H+]cyt-ratio (top) and [Ca2+]cyt-ratio (bottom) kymographs from a representative CapHensor PT imaging time-course experiment with sequential extracellular medium perfusions of different pH or low osmolarity (hypo shock). (b) Quantification of mean PT tip [Ca2+]cyt (red line), [H+]cyt (green line) and growth rate (blue line) from experiments (n = 12) with the same sequence of treatment as in (a). (c) Quantification of mean PT tip [Ca2+]cyt (red line), [H+]cyt (green line) and growth rate (blue line) from experiments (n = 8) upon 2 mM acetate (HAc) treatment or extracellular acidification (pH 5) in order to increase [H+]cyt. (d) False colored [H+]cyt-ratio (top) and [Ca2+]cyt-ratio (bottom) kymographs from a representative CapHensor PT imaging time-course experiment with sequential extracellular medium perfusion of 3 mM caffeine. (e) Quantification of mean PT tip [Ca2+]cyt (red line), [H+]cyt (green line) and growth rate (blue line) from experiments (n = 15) with the same sequence of treatment as in (d). (f) Comparison of correlation coefficients of growth vs tip [Ca2+]cyt-ratio (red) and growth vs tip [H+]cyt-ratio (green) from experiments in (b, ■ 15–25 min; ◆ 55–75 min), (c, ● 15–25 min; ○ 50–60 min) and (e, ▲ 20–30 min). Error bars = SE. Dots in (f) indicate individual measurements and t-test was used. *, P < 0.05; **, P < 0.01; ***, P < 0.001.
